The University of Nebraska-Lincoln’s official census date was Tuesday, Sept. 3, 2024. Data from the official census are now available, allowing us to examine and gain insight into our enrollment trends.
College enrollment grew by 4.8%, increasing from 1,043 in fall 2023 to 1,093 in fall 2024. At the same time, overall campus enrollment grew by 1.6%.
| College | 2023 | 2024 | % Change |
| College of Agri Sci and Natl Resources | 2850 | 2899 | 1.7% |
| College of Architecture | 628 | 604 | -3.8% |
| College of Arts and Sciences | 4218 | 4024 | -4.6% |
| College of Business | 4266 | 4398 | 3.1% |
| College of Education and Human Sciences | 3178 | 3261 | 2.6% |
| College of Engineering | 4020 | 4353 | 8.3% |
| College of Fine and Performing Arts | 931 | 962 | 3.3% |
| College of Journalism & Mass Comm | 1043 | 1093 | 4.8% |
| College of Law | 462 | 456 | -1.3% |
| Explore Center Undergraduate | 1559 | 1431 | -8.2% |
| Graduate Studies | 372 | 384 | 3.2% |
| Intercampus | 13 | 4 | -69.2% |
| Other University Programs | 15 | 12 | -20.0% |
| Visitors | 60 | 123 | 105.0% |
| Total | 23615 | 24004 | 1.6% |
Undergraduate enrollment in the college grew by 6.9%, from 979 to 1,047, while graduate enrollment declined by 28.1%, from 64 to 46.
Class Level
Undergraduate enrollment saw growth across all class levels, with the most significant increase among first-time freshmen. This year's incoming freshmen class, the largest in the college's history, grew by an impressive 18.8%, rising from 181 to 215 students.
| Class Level | 2023 | 2024 | %Change |
| First-time Freshmen | 181 | 215 | 18.8% |
| Other Freshmen | 37 | 37 | 0.0% |
| Sophomore | 207 | 217 | 4.8% |
| Junior | 289 | 305 | 5.5% |
| Senior | 263 | 271 | 3.0% |
| 2nd Degree (Senior) | 2 | 2 | 0.0% |
| Total | 979 | 1,047 | 6.9% |
It is clear from these figures that both efforts to recruit and retain both undergraduate and graduate students have been successful.
Undergraduate Enrollment
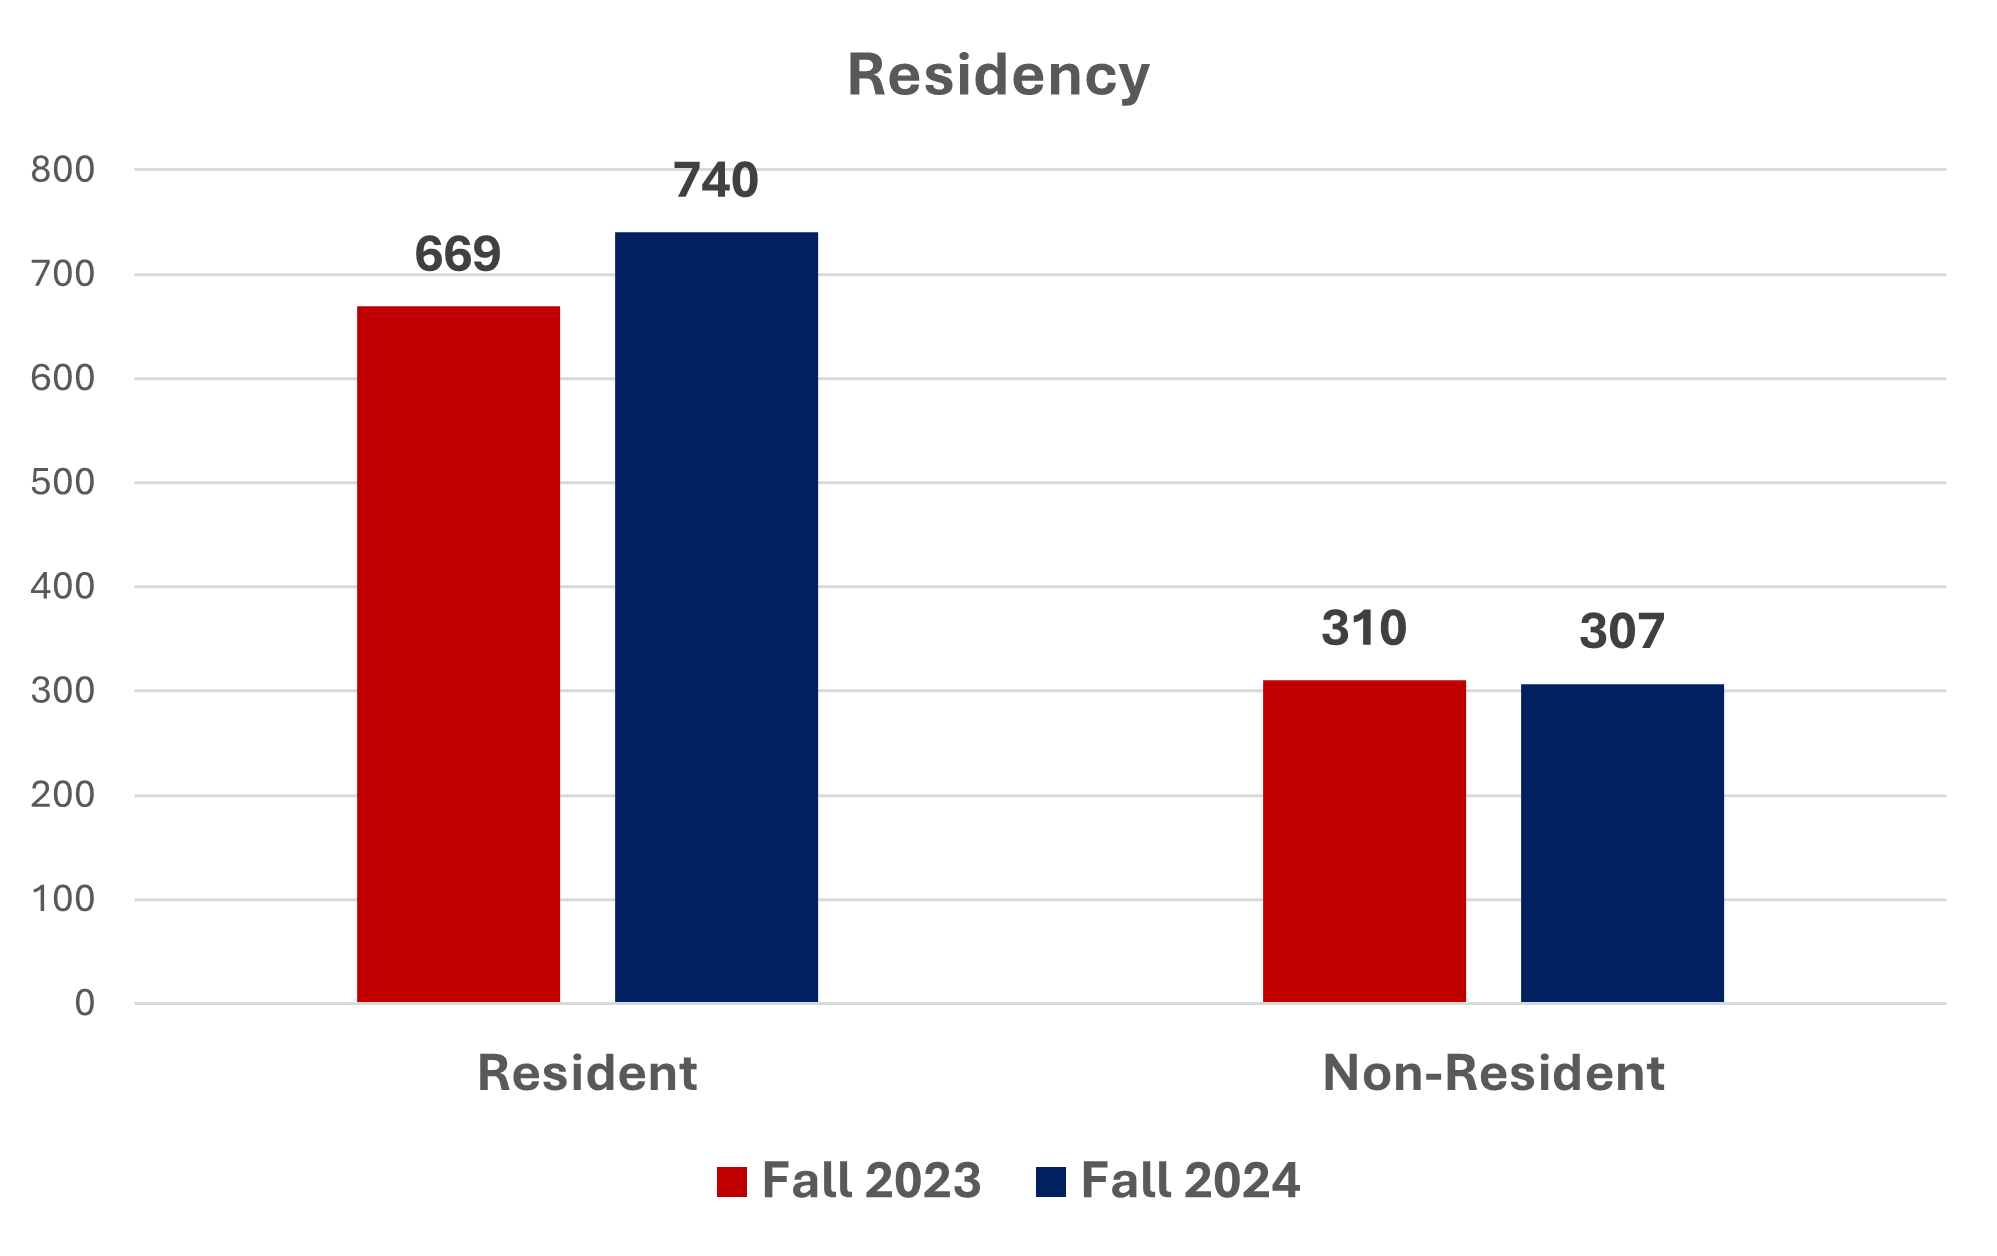
Residency
Resident student enrollment grew by 10.6%, while nonresident students declined slightly by 1%.
Majors
Sports media and communication saw the most significant growth, increasing from 323 to 391. Advertising and public relations and broadcasting also saw moderate growth, while journalism declined by 11%.
| Major | 2023 | 2024 | % Change |
| Advertising & Public Relations | 416 | 423 | 1.70% |
| Broadcasting | 115 | 122 | 6.10% |
| Journalism | 125 | 111 | -11.20% |
| Sports Media and Communication | 323 | 391 | 21.10% |
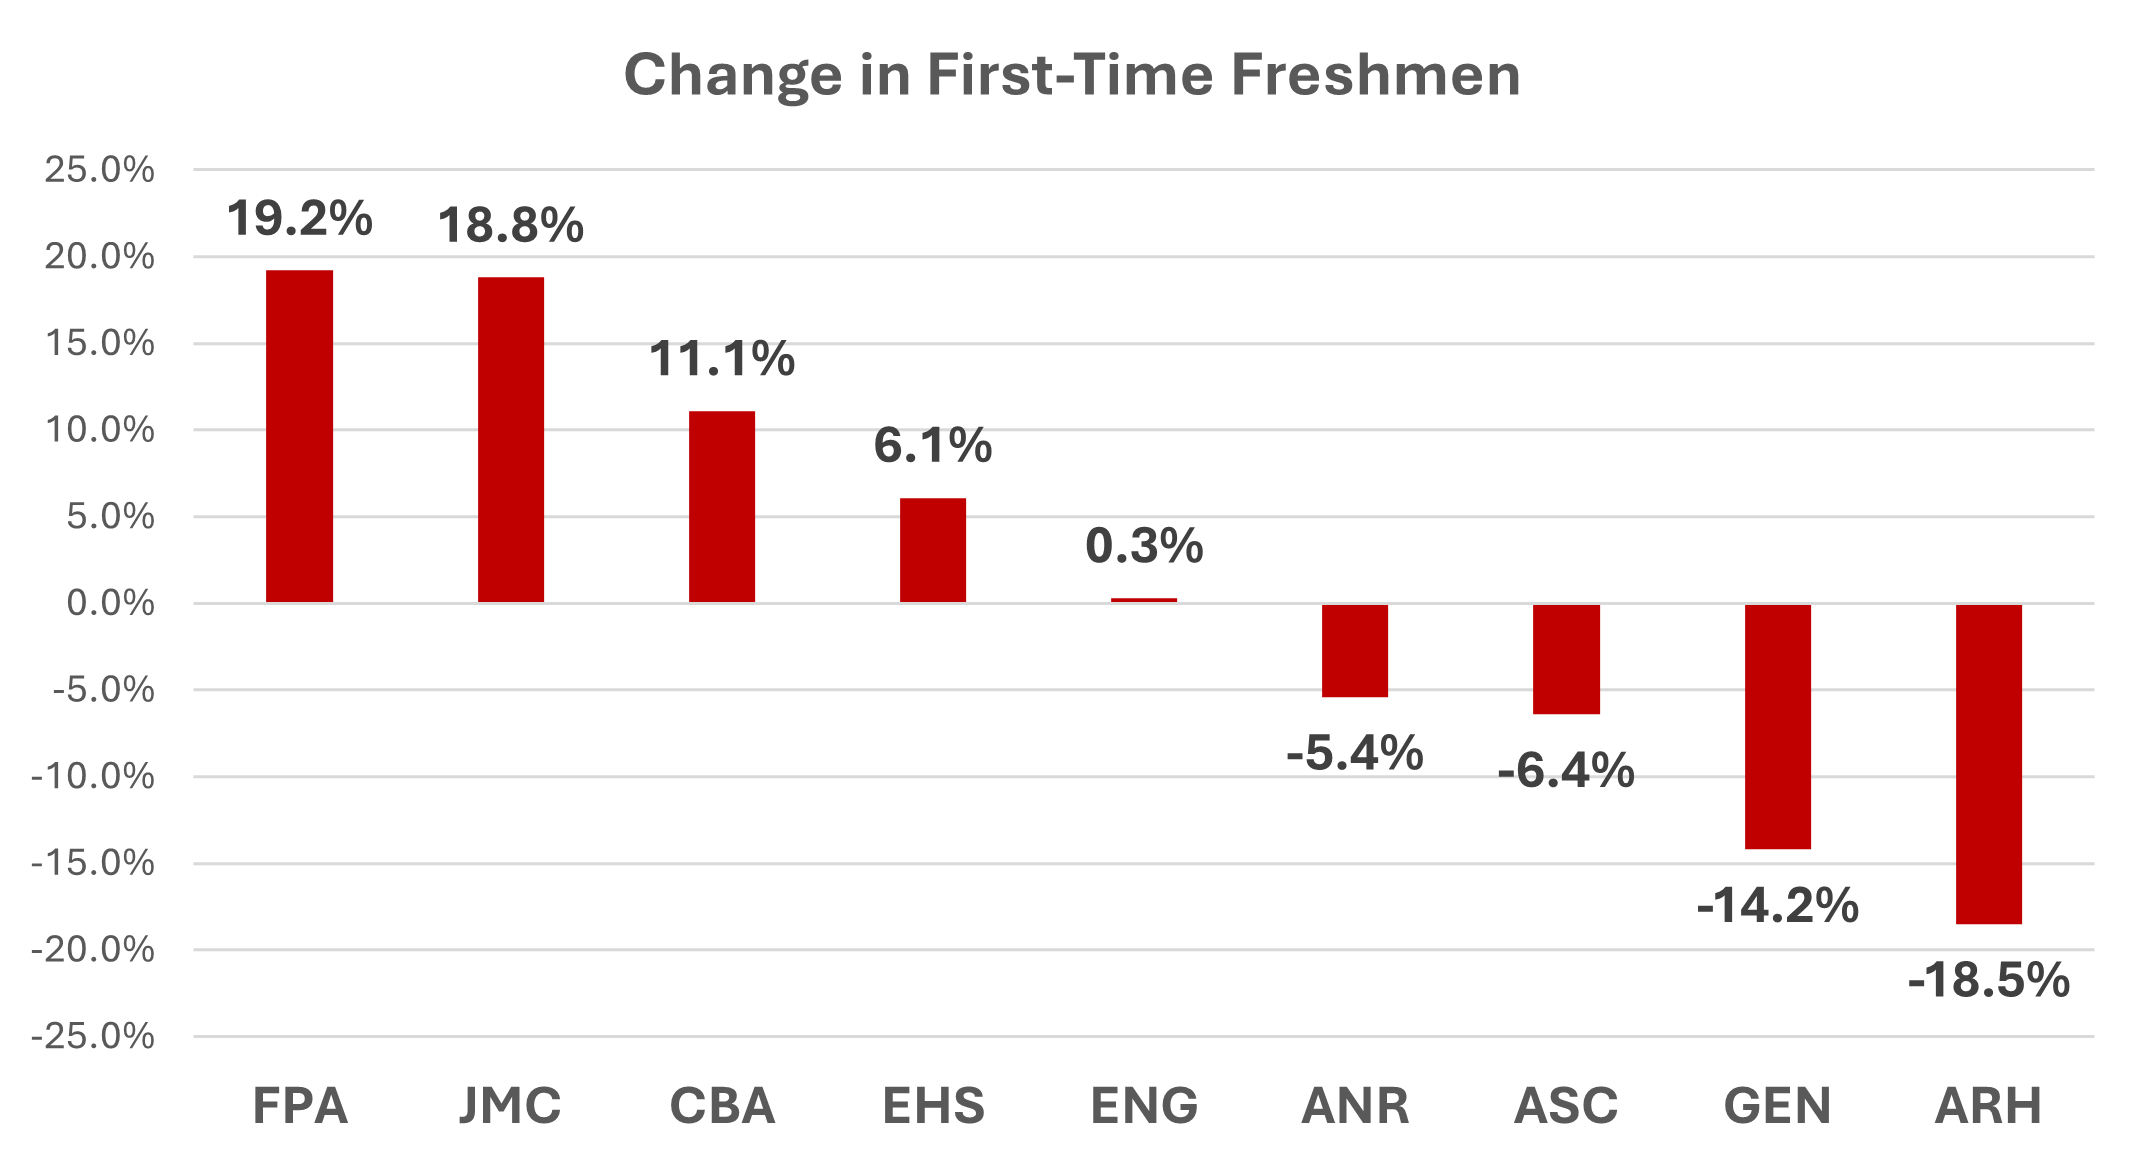
First-time Freshmen
The College of Journalism and Mass Communications saw a significant increase in first-time freshmen enrollment, growing by 18.8% from 181 students in Fall 2023 to 215 students in Fall 2024. This marks one of the largest percentage increases among colleges, contributing to the college's largest incoming freshmen class in its history.
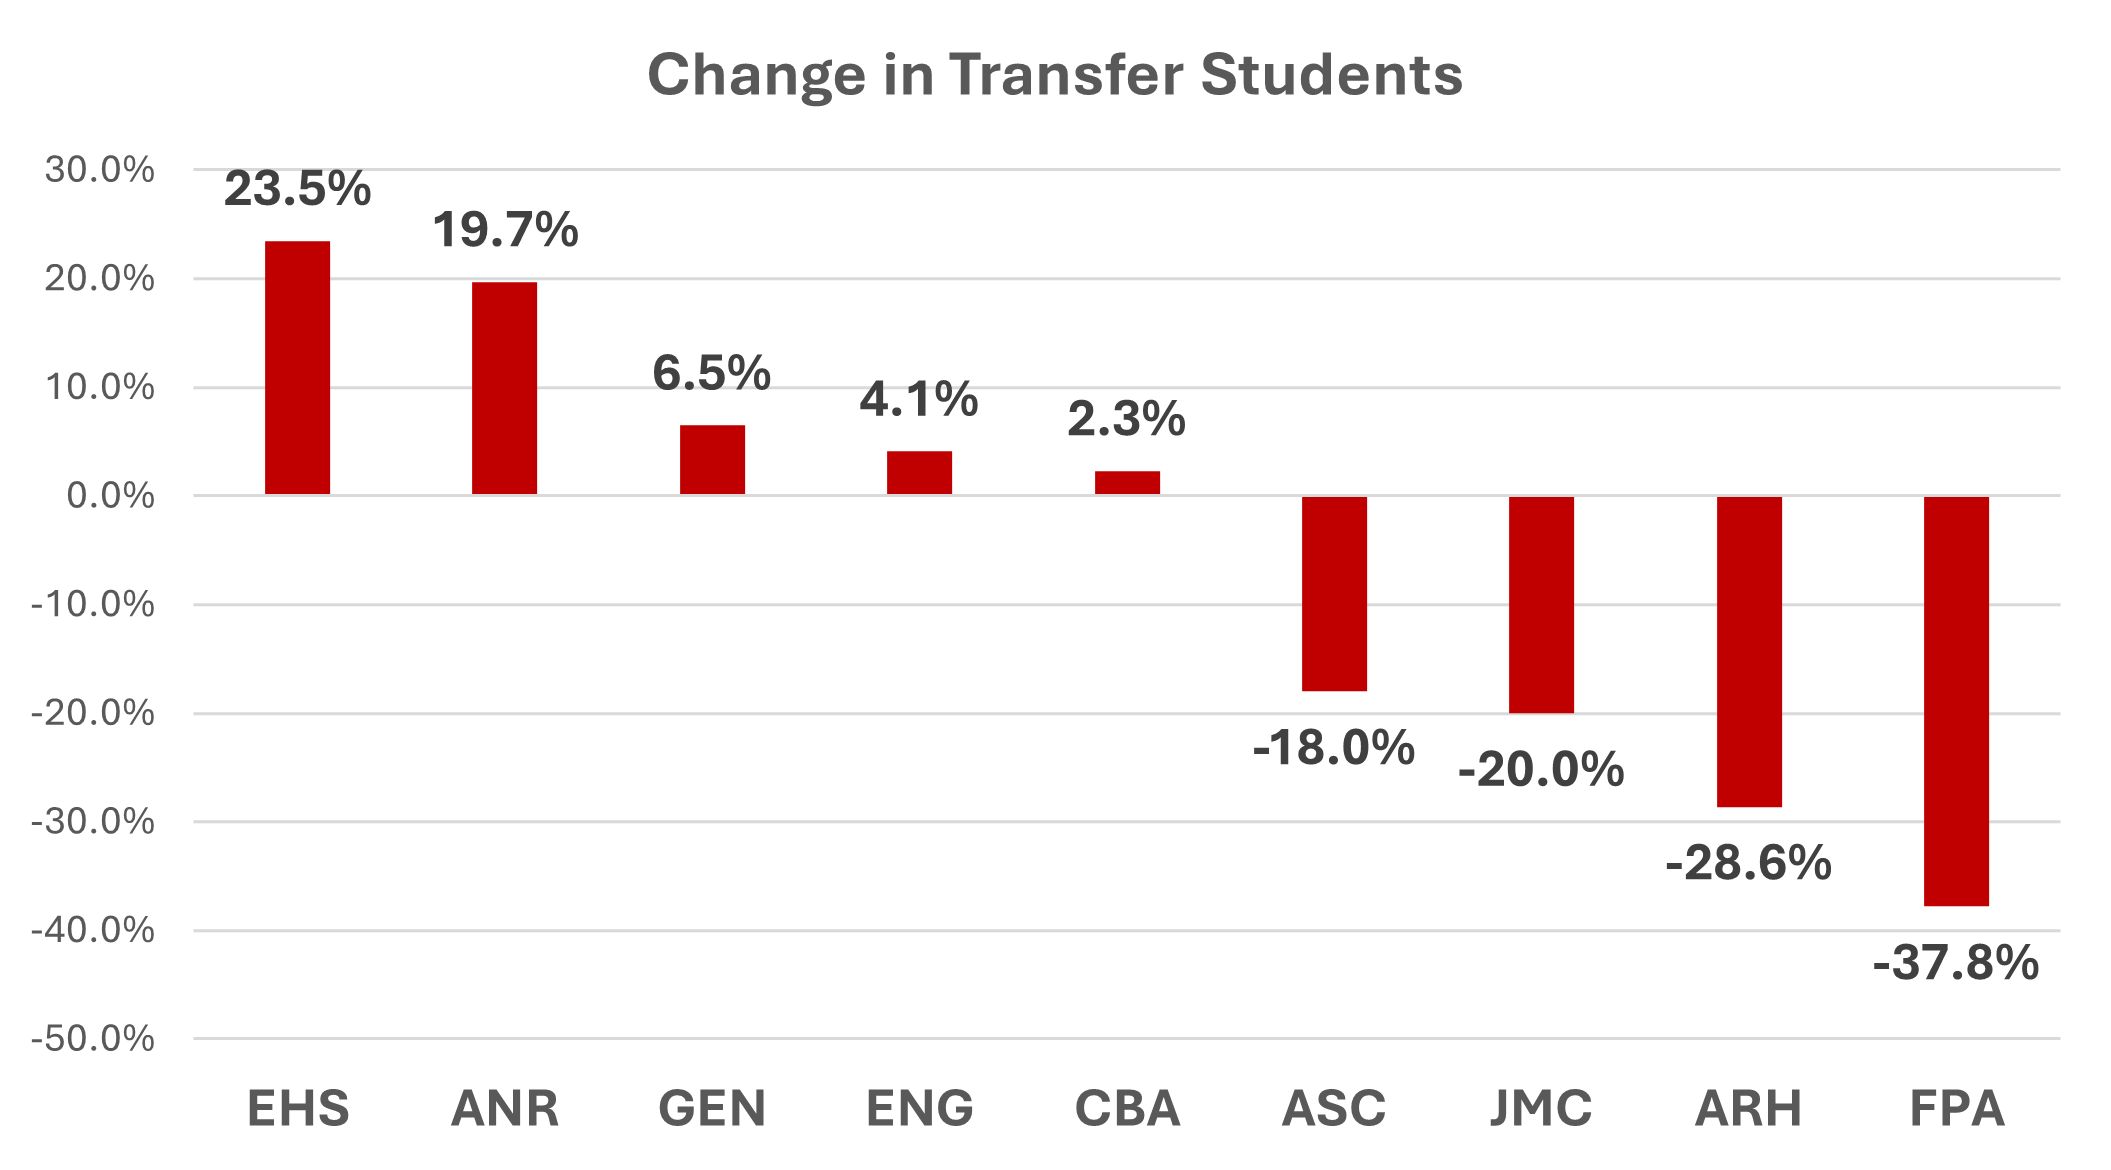
Transfer Students
The College of Journalism and Mass Communications experienced a decline in transfer student enrollment, decreasing by 20% from 30 students in Fall 2023 to 24 students in Fall 2024. This represents a significant drop compared to other colleges.
Race/Ethnicity
The college saw modest progress in enrolling underrepresented students, with slight increases in some groups such as Hispanic (up 1.1%) and Two or more races (up 6.4%). However, the college will need to address declines in other groups, notably Black or African American students (down 10.3%) and U.S. non-residents (down 33.3%), to increase enrollment diversity.
| Race/Ethnicity | 2023 | 2024 | % Change |
| American Indian or Alaska Native | 2 | 3 | 50.0% |
| Asian | 18 | 21 | 16.7% |
| Black or African American | 39 | 35 | -10.3% |
| Hispanic | 94 | 95 | 1.1% |
| Native Hawaiian or Other Pacific Islander | 1 |
| |
| Two or more races | 47 | 50 | 6.4% |
| U.S. Nonresident | 18 | 12 | -33.3% |
| Unknown race and ethnicity | 6 | 3 | -50.0% |
| White | 755 | 827 | 9.5% |
| Total | 979 | 1047 | 6.9% |
Gender
The data shows that while the College continues to have a higher proportion of female students, efforts to increase gender equity are yielding results. Male enrollment increased by 10.2% from 413 to 455, outpacing the 4.6% growth in female enrollment. This suggests that the college is making progress in balancing gender representation, though it remains female-dominated overall.
| Gender | 2023 | 2024 | %Change |
| Female | 566 | 592 | 4.6% |
| Male | 413 | 455 | 10.2% |
| Total | 979 | 1047 | 6.9% |
Country
The number of countries represented in our student body declined from 16 to 12 in fall 2024. All countries have one student enrolled, except for Canada, Egypt and Vietnam, which have two and the US, which has 1,032. The number of international students also declined from 24 to 15.
States
The number of states represented in our student body declined slightly from 34 to 33 in fall 2024.
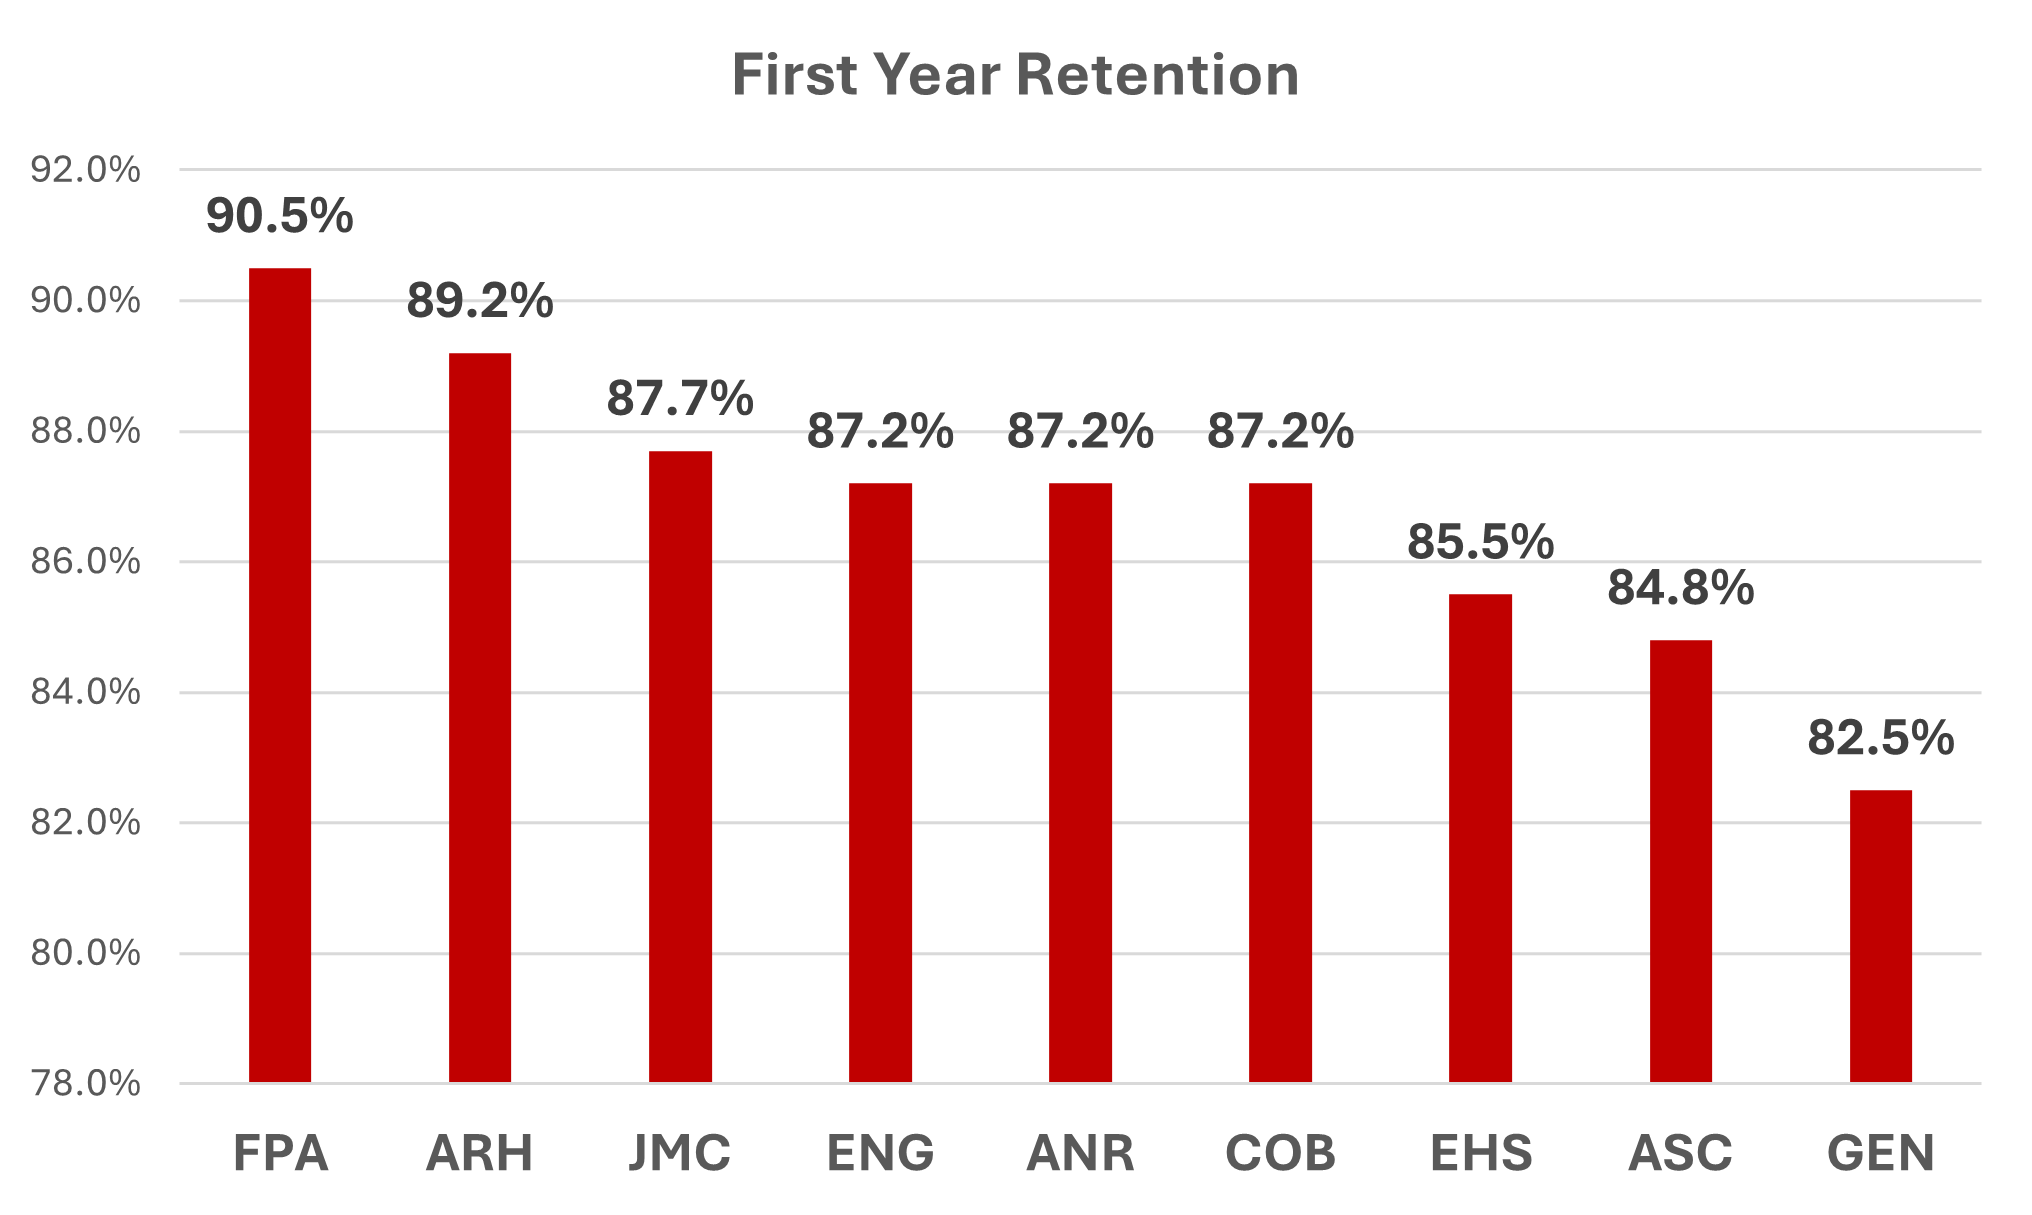
Retention Rate
Although the college’s retention rate declined from 91.2% to 87.7% this year, the college continues to perform at the top in first-year student retention. This year, the college’s retention rate was only edged out by the Colleges of Fine and Performing Arts and Architecture.
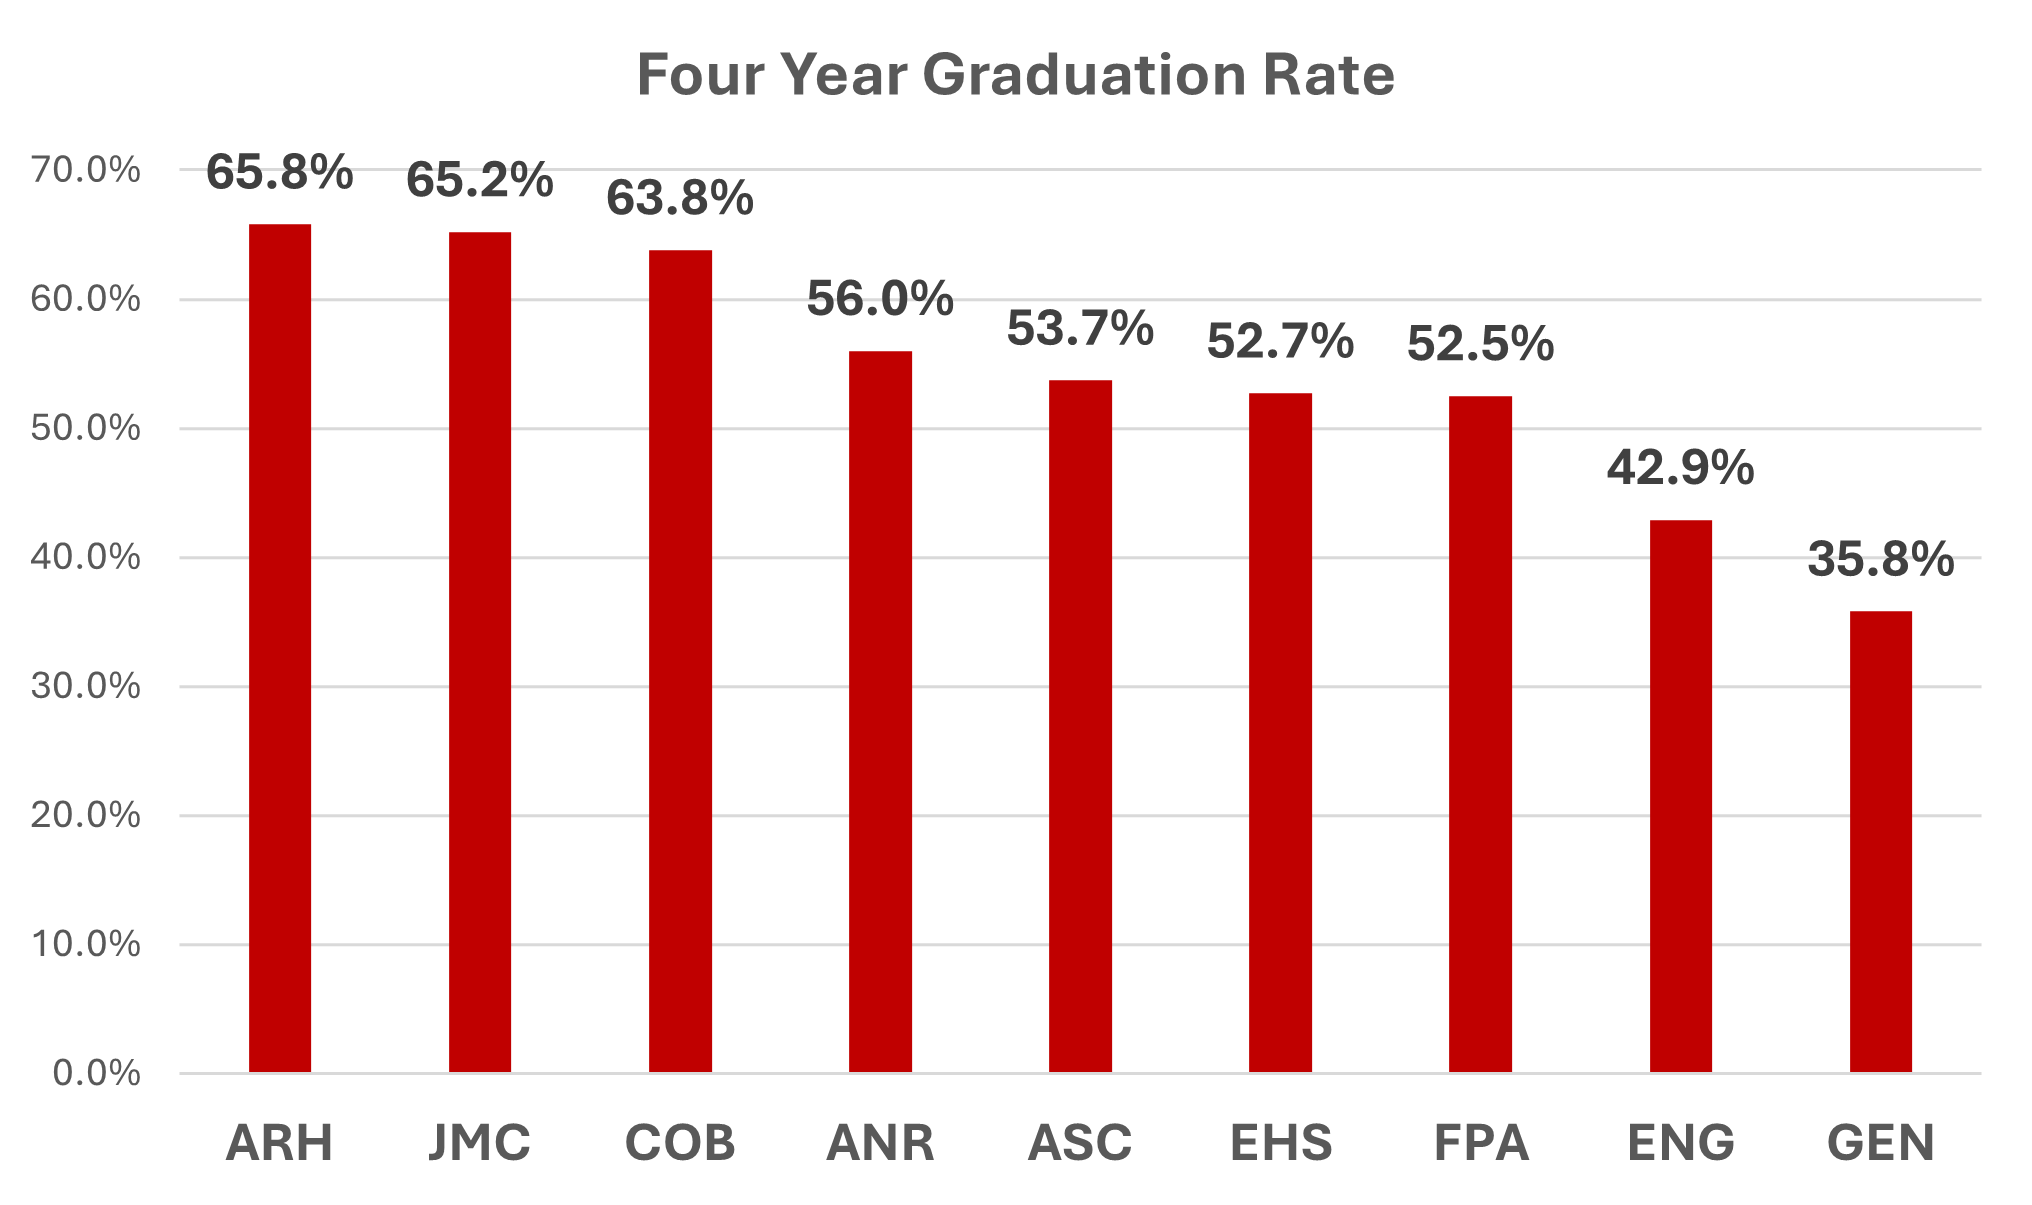
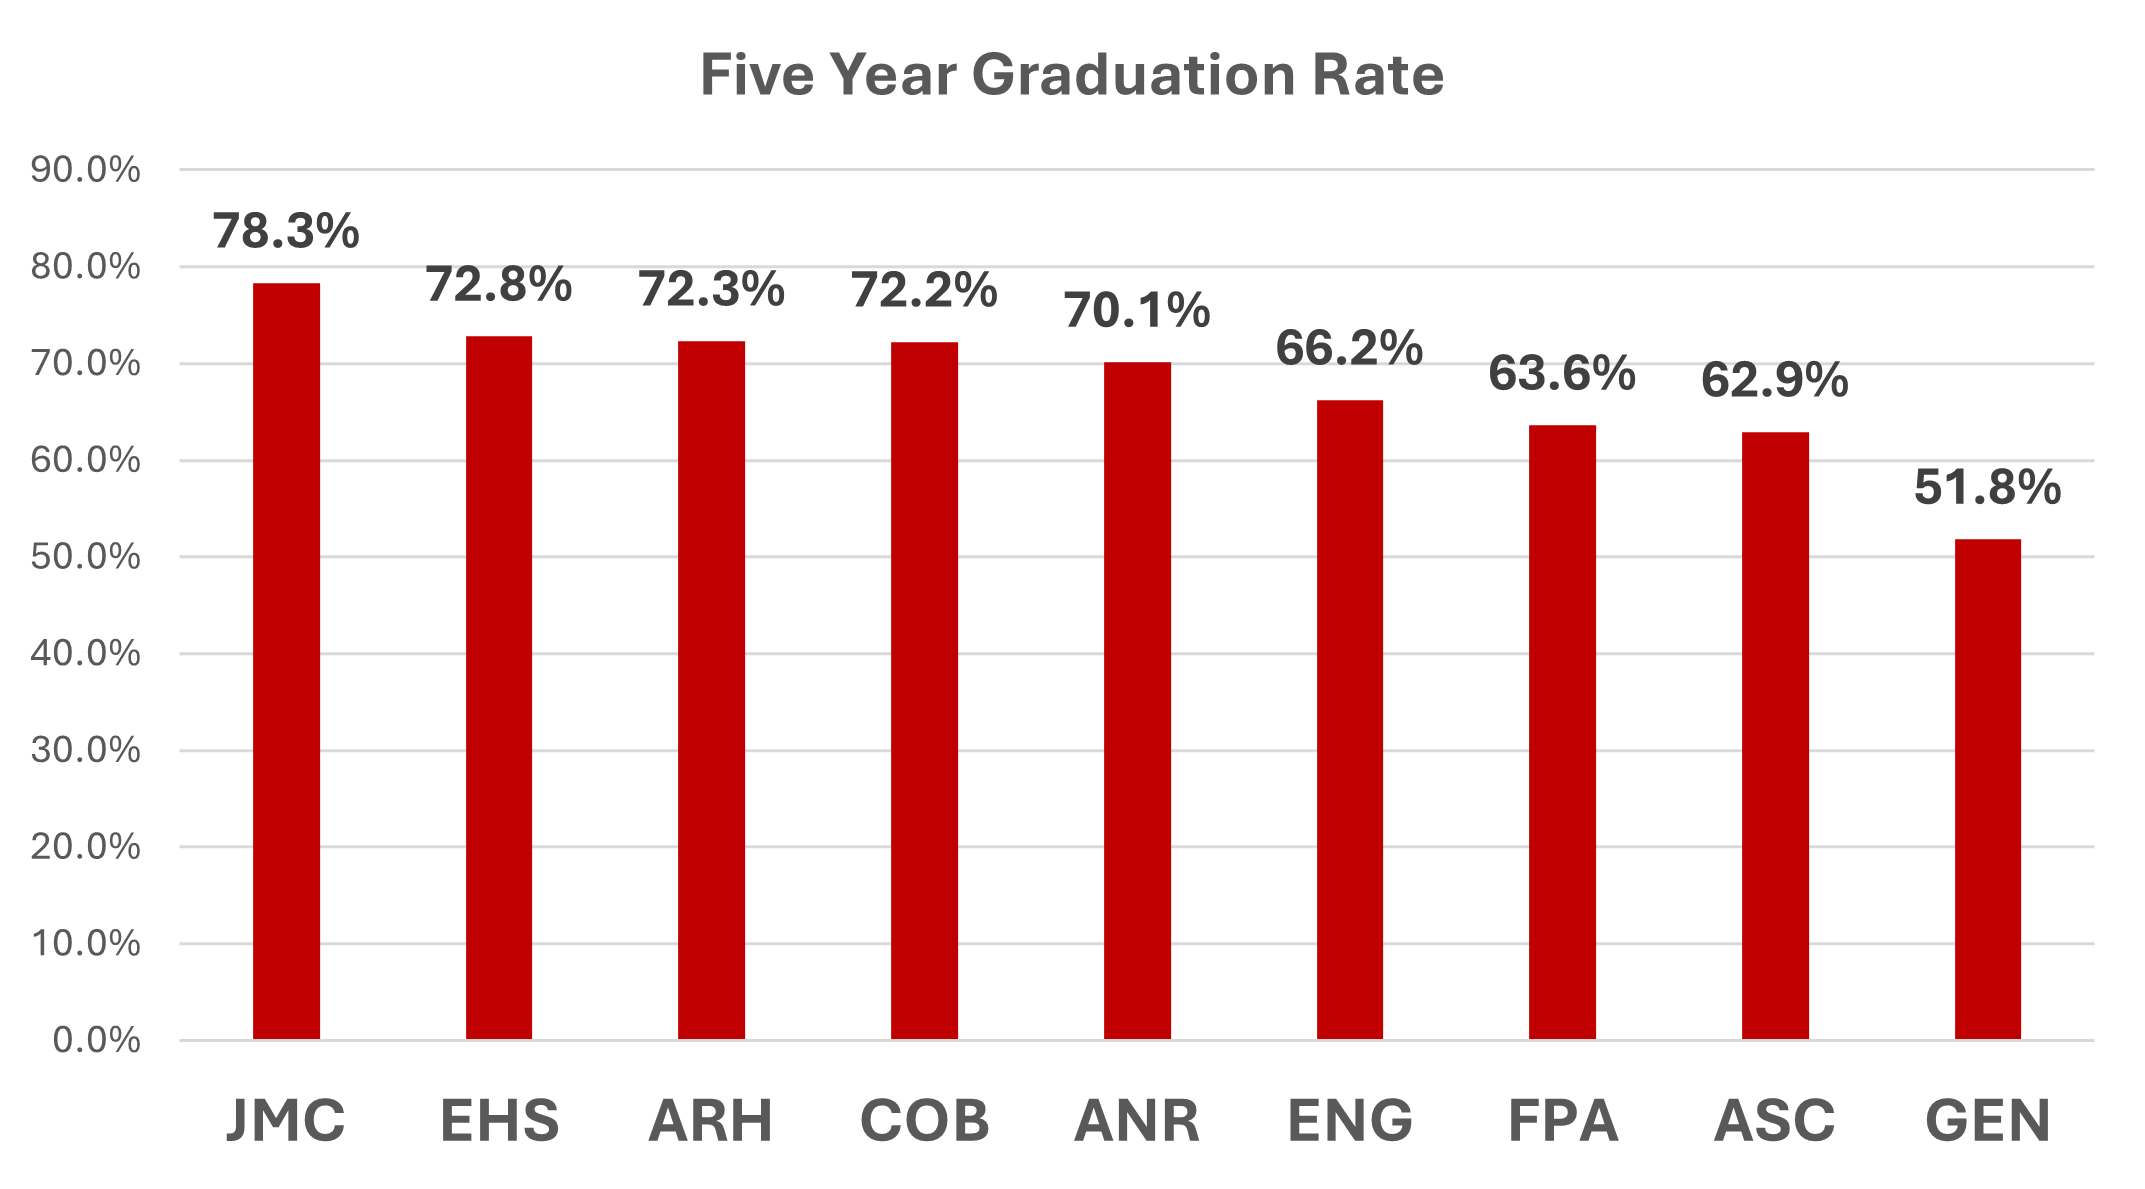
Graduation Rates
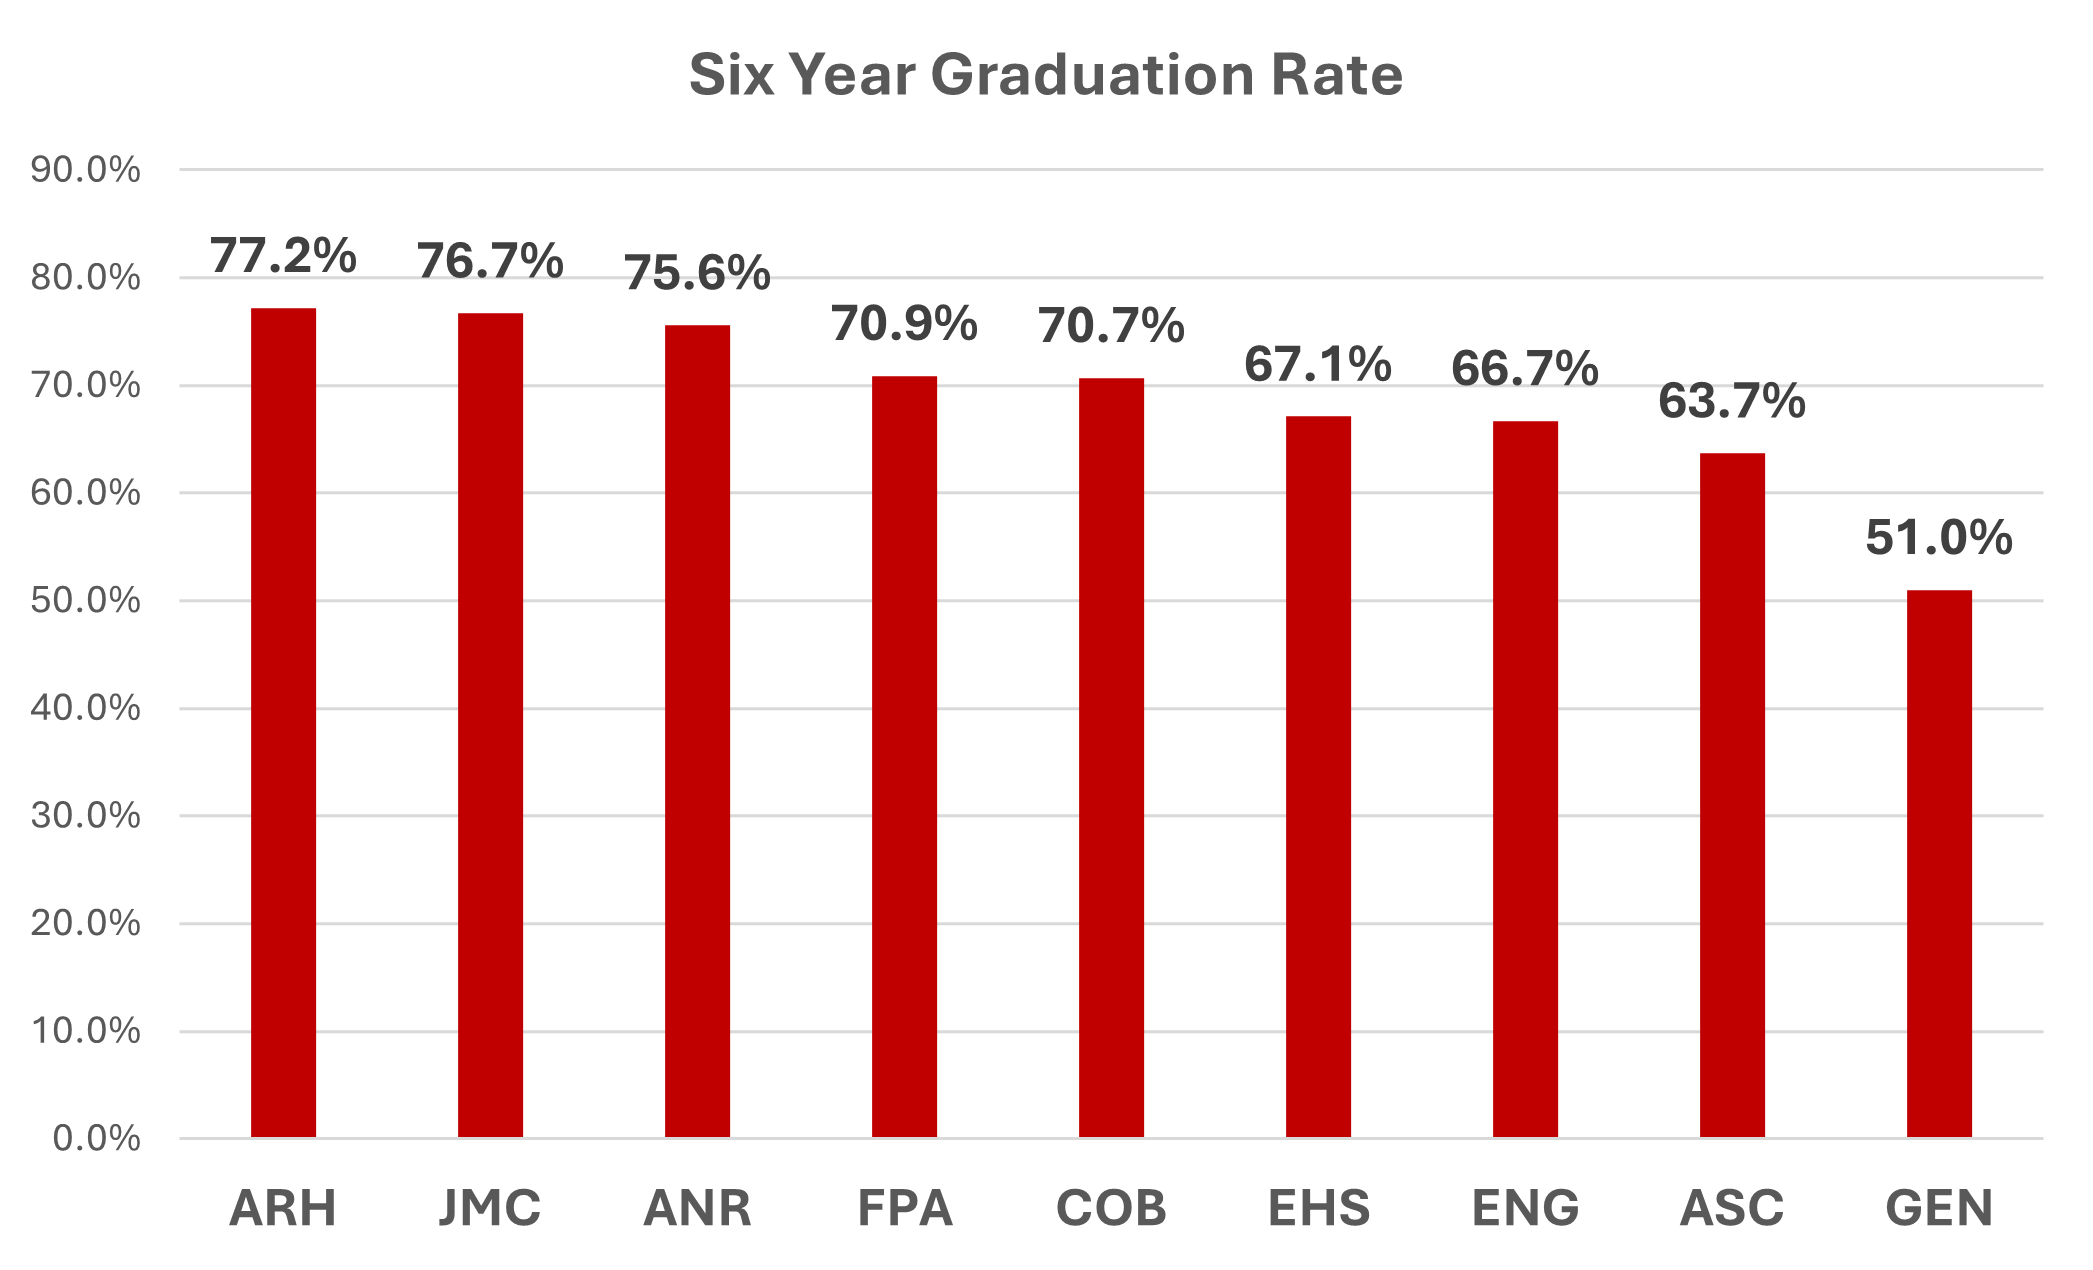
The college continues to lead in graduation success, significantly increasing its four-, five-, and six-year graduation rates. The four-year graduation rate rose from 61.7% to 65.2%, just three years after surpassing 60% for the first time. The five-year rate increased from 76.7% to 78.3%. The most notable improvement was in the six-year graduation rate, which saw a substantial jump from 64.3% last year to 76.7% this year. These gains underscore the college's commitment to student success and timely degree completion.
Graduate Students
While the college has seen positive trends in undergraduate student enrollment, retention and graduation rates, graduate student enrollment has declined significantly. Overall graduate enrollment declined by 28.1%, falling from 64 in fall 2023 to 46 in fall 2024. Declines were experienced in both the master’s and certificate programs.
| Program | 2023 | 2024 | %Change |
| Master's | 50 | 39 | -22.0% |
| Certificate | 14 | 7 | -50.0% |
| Total | 64 | 46 | -28.1% |
Specialization
All graduate programs saw enrollment declines, except professional journalism, which grew from seven to eight students.
| Specialization | 2023 | 2024 | %Change |
| Integrated Media Communications | 35 | 25 | -28.6% |
| No Specialization | 8 | 6 | -25.0% |
| Professional Journalism | 7 | 8 | 14.3% |
| Public Relations & Social Media Certificate | 14 | 7 | -50.0% |
| Total | 64 | 46 | -28.1% |
Class Level
We saw declines in both incoming and returning graduate students, indicating there is room for improvement in both recruitment and retention of this population.
| Class Level | 2024 | 2023 | %Change |
| First-time Graduate | 11 | 23 | -52.2% |
| Other Graduate | 35 | 41 | -14.6% |
| Total | 46 | 64 | -28.1% |
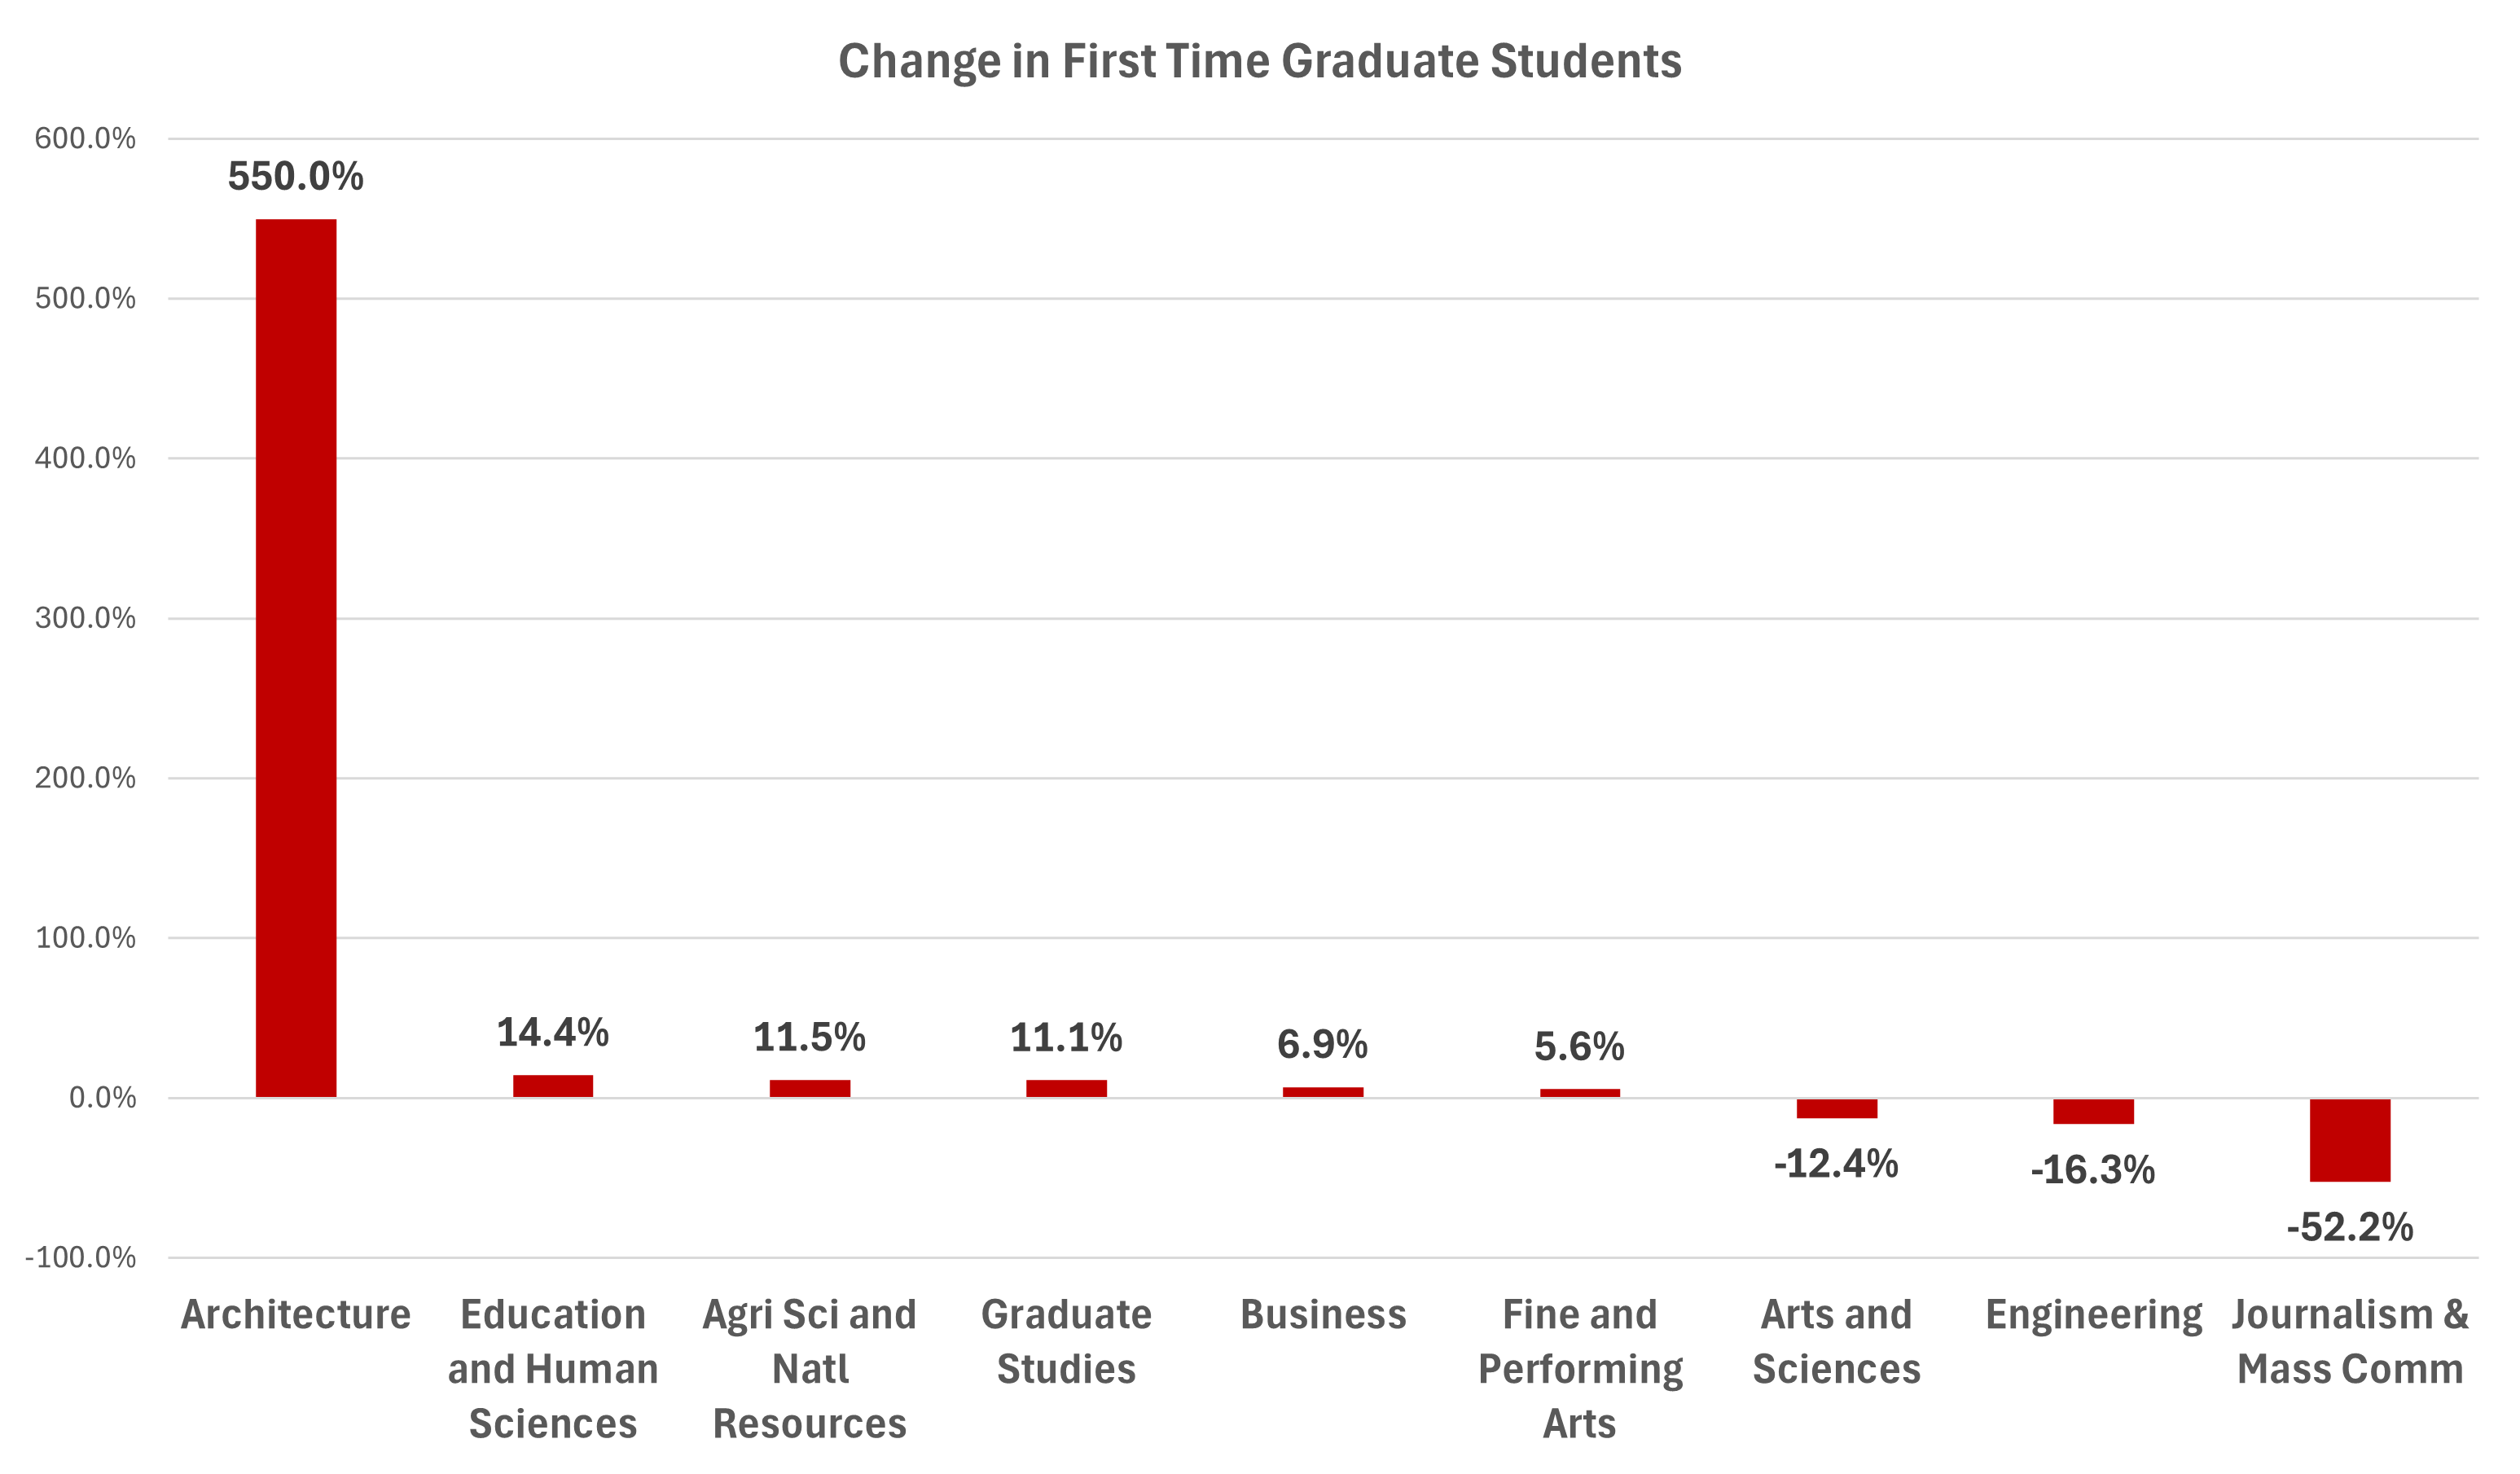
Our decline in first-time graduate students was the largest decline on campus, indicating we need to review efforts to enroll students in our programs.
Race/Ethnicity
The data shows a decline among Asian, Black or African American, and White students. Despite some growth in students identifying as Two or more races, the lack of progress in enrolling other underrepresented groups suggests the need for more targeted recruitment and retention efforts.
| Race/Ethnicity | 2023 | 2024 | % Change |
| Asian | 2 | -100.0% | |
| Black or African American | 3 | 1 | -66.7% |
| Hispanic | 2 | 2 | 0.0% |
| Two or more races | 3 | 5 | 66.7% |
| U.S. Nonresident | 8 | 7 | -12.5% |
| Unknown race and ethnicity | 1 | 1 | 0.0% |
| White | 45 | 30 | -33.3% |
| Total | 64 | 46 | -28.1% |
Gender
Graduate enrollment declined for both genders, with male students dropping 36% and female students 23.1%. The sharper decrease in male enrollment challenges efforts to maintain gender balance.
| Gender | 2023 | 2024 | %Change |
| Female | 39 | 30 | -23.1% |
| Male | 25 | 16 | -36.0% |
| Grand Total | 64 | 46 | -28.1% |
Country
International enrollment saw a slight decrease from eight to seven students in 2024, with the number of countries represented dropping from eight to six.
States
The proportion of resident students declined from 73% in fall 2023 to 63% in fall 2024. This fall, students hail from 11 states.
The Fall 2024 Census Report highlights areas of success and opportunity in the college’s efforts to increase overall student enrollment. Undergraduate enrollment saw a healthy 6.9% growth, particularly driven by a significant rise in first-time freshmen and growth in popular majors like sports media and communication. However, graduate enrollment declined sharply by 28.1%, signaling the need for improved recruitment and retention strategies at the graduate level. While the college progressed in achieving gender balance and enrolling more underrepresented groups, such as students of two or more races, declines in other racial/ethnic groups, transfer students, and international enrollment indicate key areas for focused improvement. The college’s strong performance in retention and graduation rates for undergraduates underscores its commitment to student success. However, further attention is needed to reverse the downward trend in graduate programs and diversify the student body.