The 2025 College of Journalism and Mass Communications Employee Climate Survey offers a compelling snapshot of a college steadily strengthening its culture. Of the 144 faculty, staff, graduate assistants and student workers invited, 51 responded, yielding a 42% response rate. Using a 17-item instrument on a five-point Likert scale (0 = strongly disagree to 4 = strongly agree), the survey assesses perceptions of belonging, leadership, communication, inclusion and engagement.
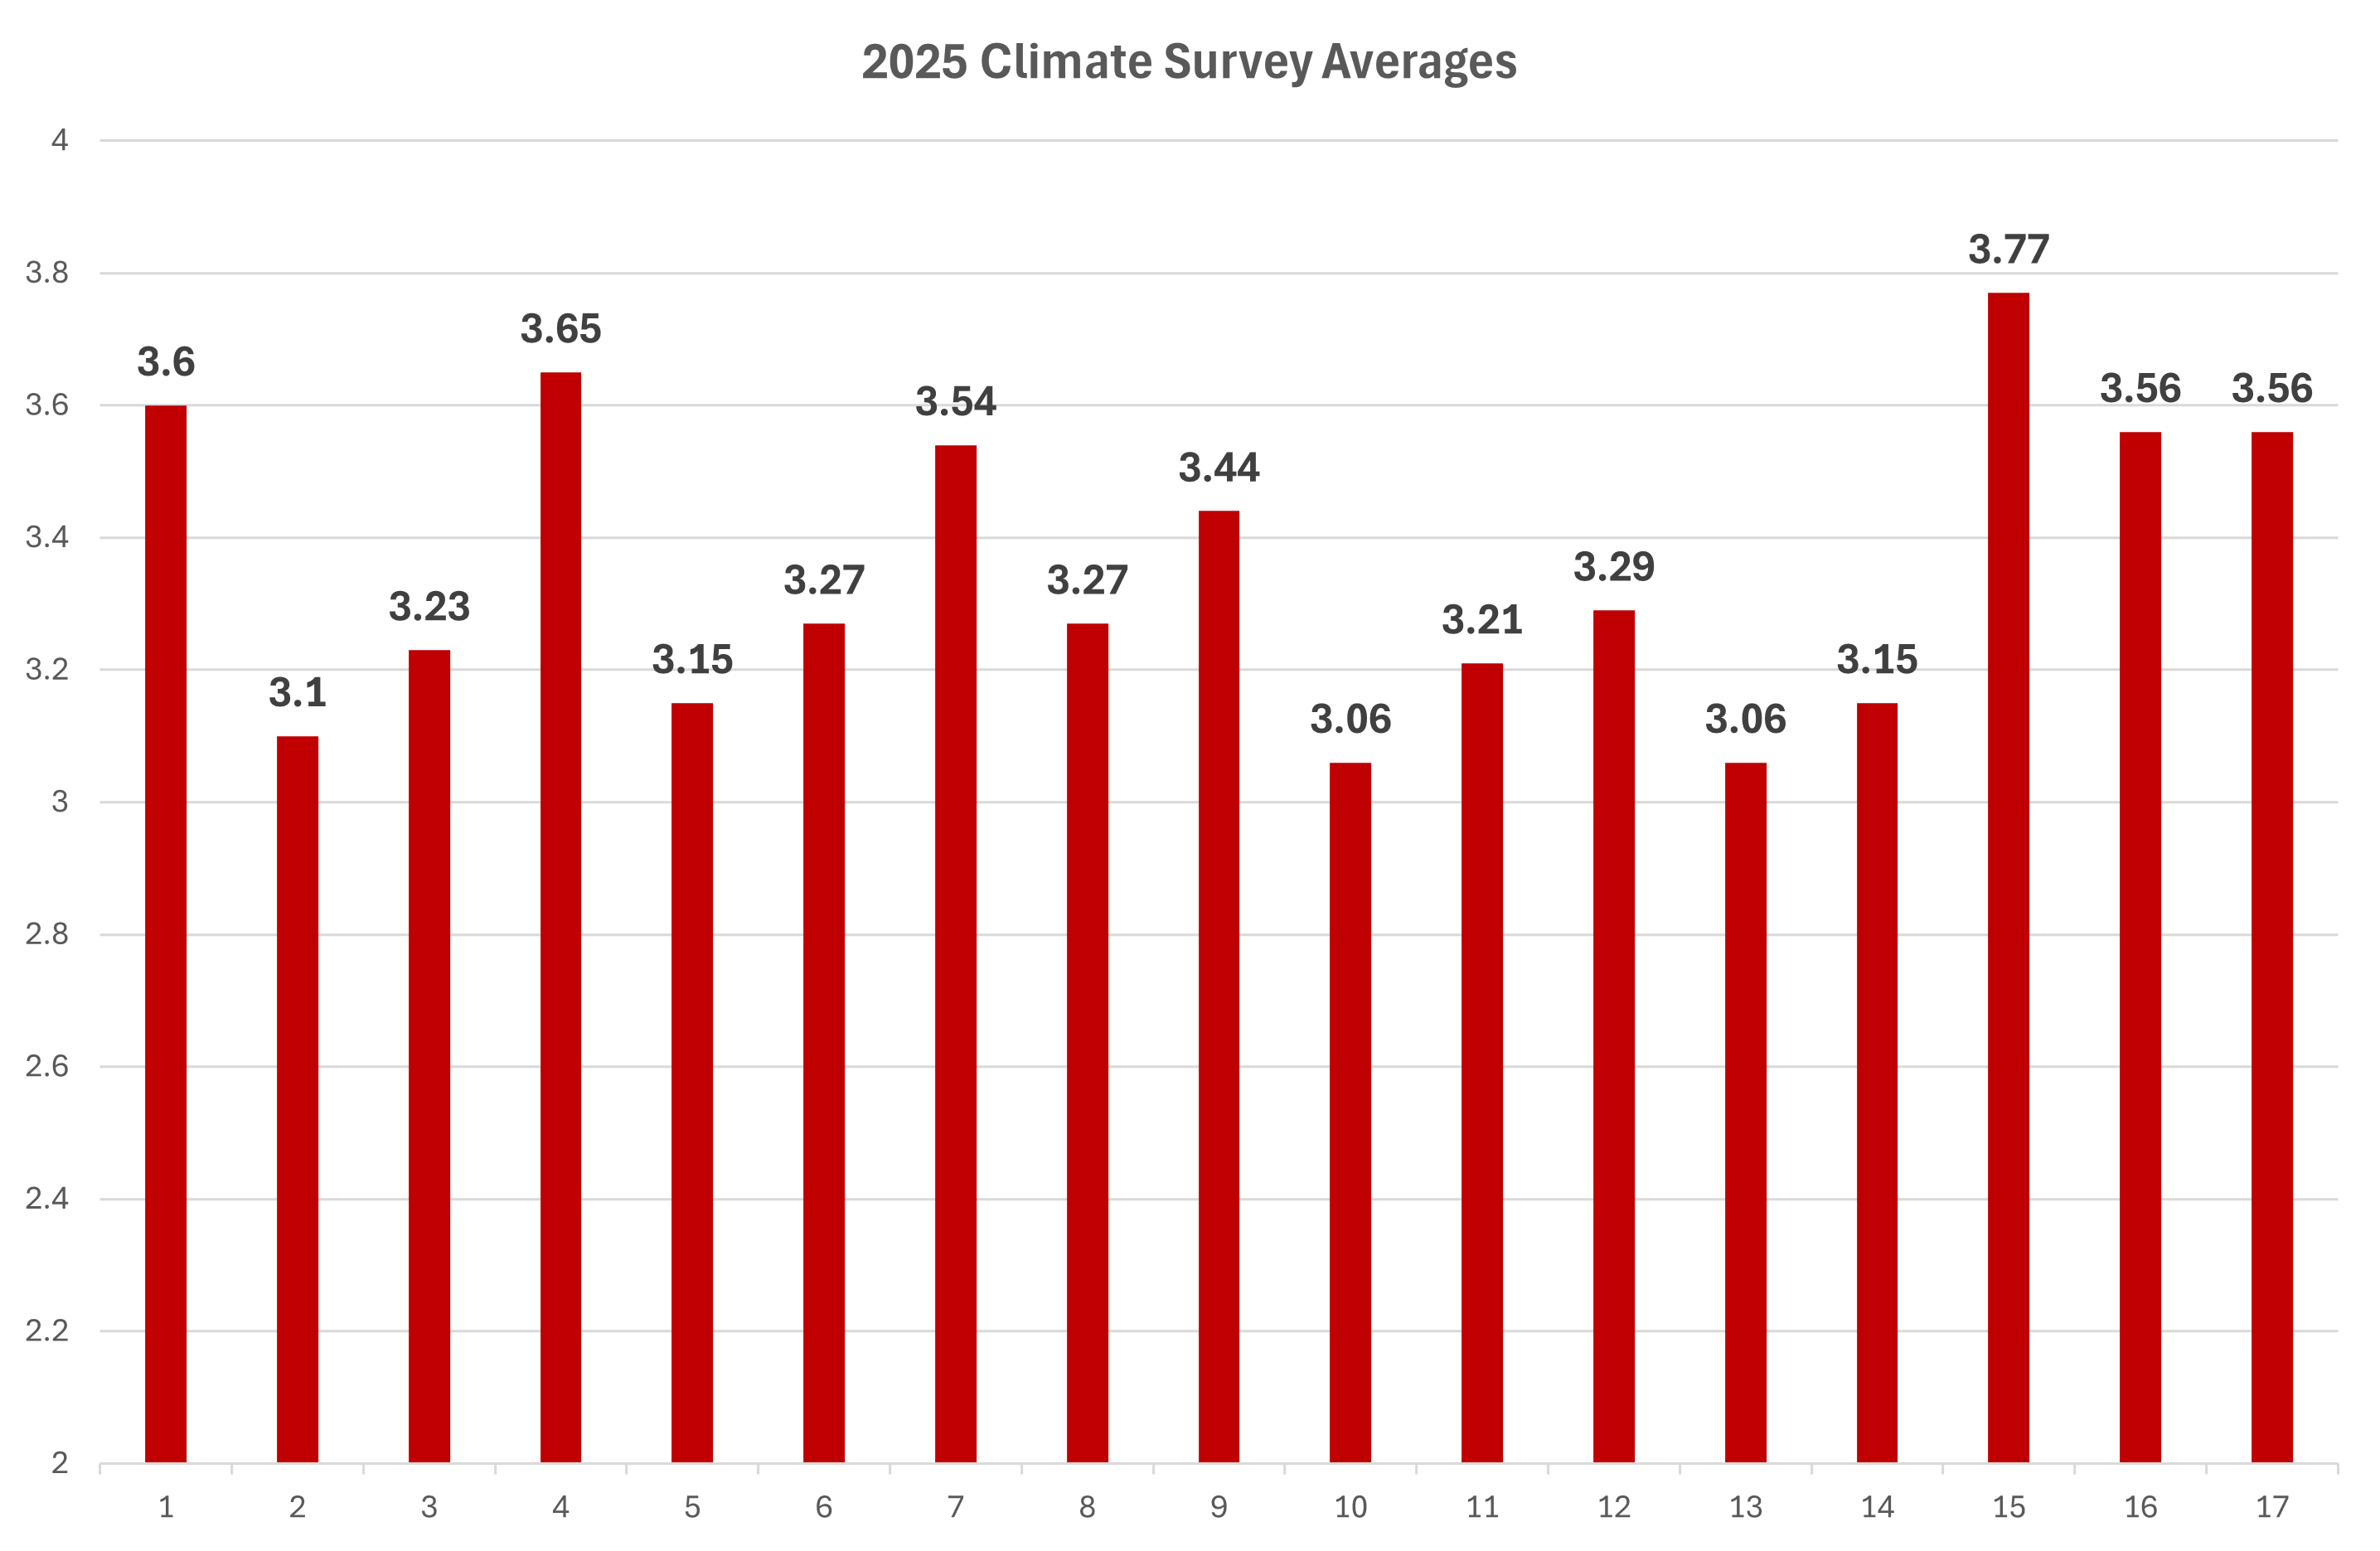
The clearest throughline in this year’s results is growth. Employees overwhelmingly reported feeling connected to the college’s mission, with the highest-rated item—“I believe my work positively impacts the success of our students, faculty and staff”—scoring 3.77. Respondents also indicated strong relationships with their direct supervisors (3.65), alignment with institutional goals (3.6), and pride in being part of the university (3.56). Communication from leadership (3.56) and support for professional development (3.54) were also strong, affirming that strategic efforts in these areas are gaining traction. This alignment between institutional action and employee perception reflects a maturing organizational culture—one that increasingly centers transparency, purpose and support.
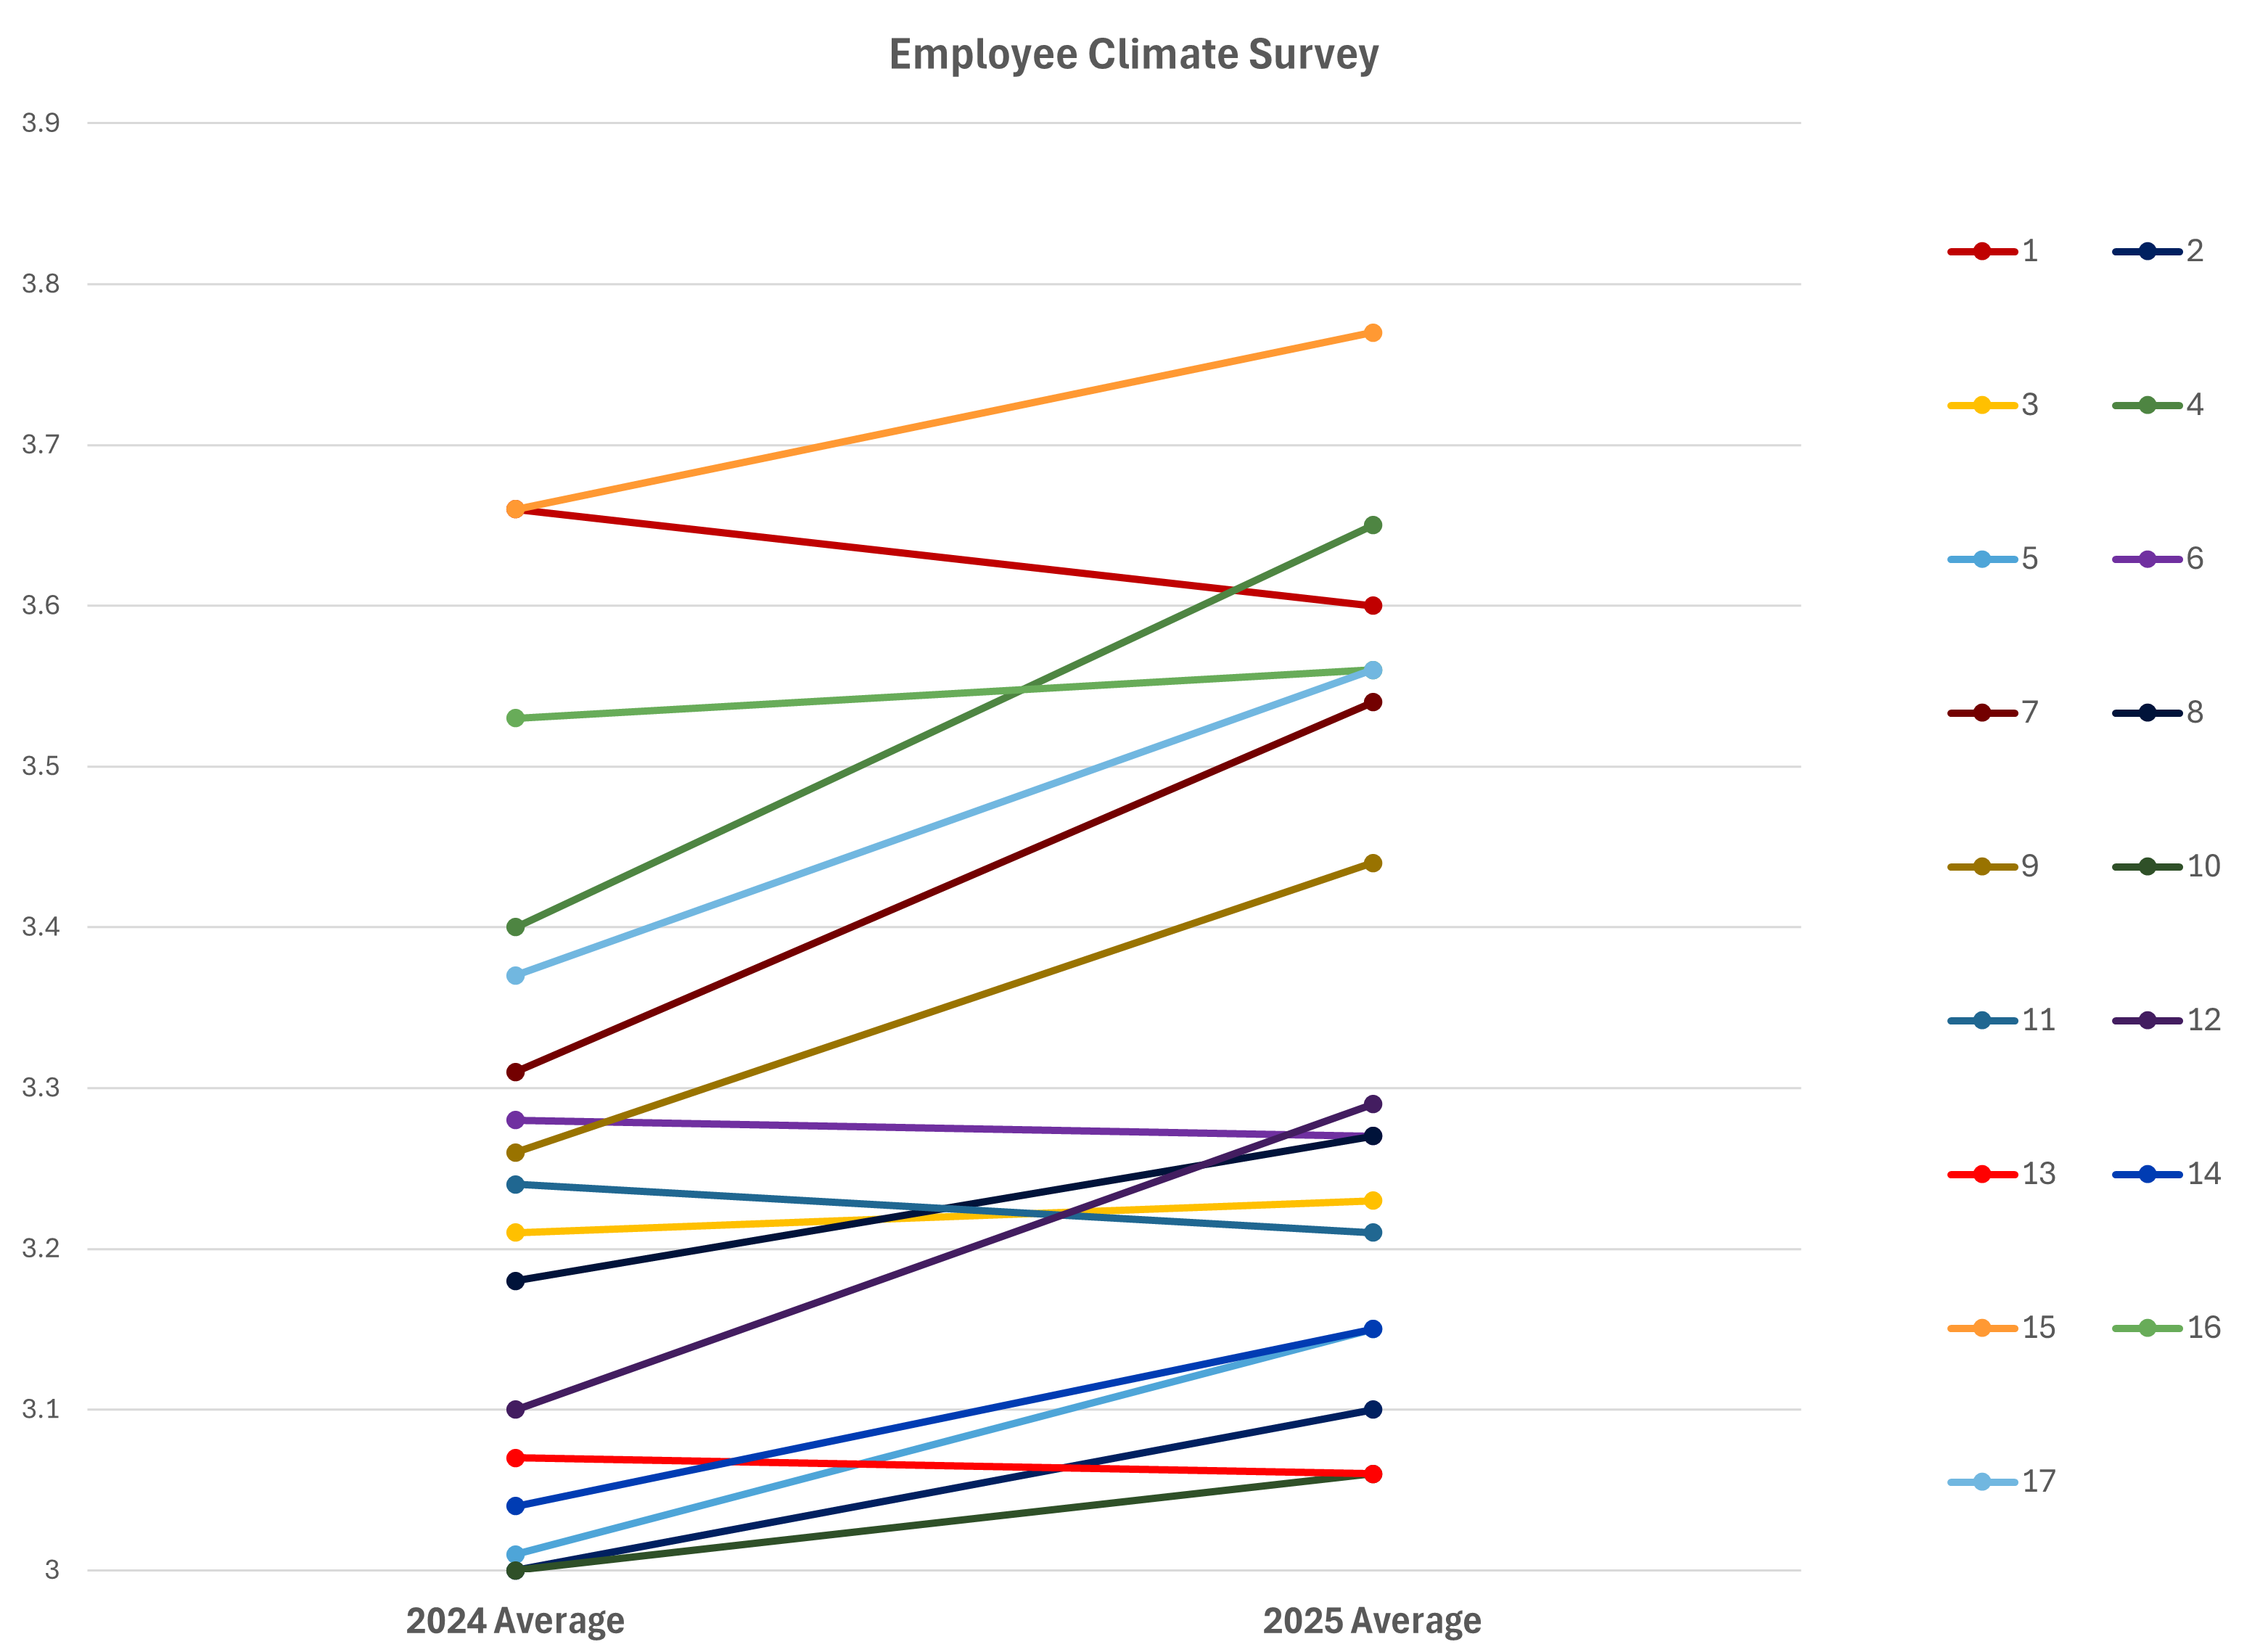
Equally important is the evidence of improvement. Year-over-year comparisons show meaningful gains across nearly all items, with particularly notable growth in supervisory respect (+0.25), professional development (+0.23), leadership communication (+0.19) and opportunities to improve instruction (+0.18). These increases are not coincidental—they suggest that college investments in these areas are beginning to yield measurable returns in employee experience. Even modest gains in inclusion-related measures—such as representation in decision-making (+0.06) and recognition (+0.02)—signal signs of progress in building a more participatory environment.
The data also underscores persistent challenges. Items related to psychological safety—feeling safe to speak up (3.06), having one’s voice represented (3.06) and participating meaningfully in decisions (3.15)—remain at the bottom of the rankings, despite slight improvements or stagnation. The consistency of these scores year over year suggests that while external support structures are improving, internal confidence in speaking up or challenging the status quo may lag behind. These findings point to a need for deeper cultural work around trust and shared governance—areas that often take longer to shift but are essential to long-term institutional health.
Disaggregated data reveals more nuanced insights. Graduate assistants reported some of the most positive perceptions, with several items scoring near or at 4.0 and many increasing by 0.6 or more. These findings may reflect improved onboarding or more intentional efforts to engage graduate students in academic life. Staff members also reported high scores and sharp year-over-year gains in areas such as recognition, well-being and involvement in decisions, reinforcing the positive effects of recent institutional efforts to expand development opportunities.
Faculty responses, while generally positive, indicate a more measured experience. Improvements in professional development and feeling heard are encouraging, but scores related to psychological safety and shared decision-making remain middling. This cohort’s moderate but steady upward trend suggests cautious optimism—progress is being felt, but more work is needed to deepen engagement at this level.
Student workers reported the most concerning results. Their year-over-year scores declined across nearly all measures, in some cases significantly—such as a 0.57 decline in recognition. Their current scores lag far behind every other group, indicating a sense of disconnection that warrants focused attention. These results suggest that student workers may feel peripheral to the college community and are not fully benefiting from the broader cultural improvements experienced by other groups.
An analysis by length of service further illuminates these dynamics. Employees with more than 20 years at the college reported the most positive climate in 2025, with dramatic year-over-year increases in leadership communication, shared decision-making and pride in the institution. Similar trends were observed among those with 10 to 20 years of service, reflecting strong gains and a deepening sense of connection. In contrast, employees with five to 10 years of experience reported the lowest satisfaction and the sharpest declines, especially in areas tied to leadership communication, voice and psychological safety. This group may be facing a critical inflection point in their careers—no longer new but perhaps still lacking influence or clarity in their roles—making them more sensitive to gaps in communication, recognition or inclusion.
Employees with three to five years of service show a more mixed experience. While several items remained stable, they also reported the most substantial year-over-year improvement in openness to innovation (+1.18), decision-making representation (+0.35) and DEI engagement (+0.12). However, some categories declined, including supervisor respect (-0.37), suggesting variable experiences depending on role. Despite some modest gains, this group appears to be in a transitional space—neither new nor fully established—indicating the potential need for targeted development or mentoring opportunities to reinforce connection and growth.
Newer employees, those with one to three years of service, offer a generally positive and stable view of the college. Scores are consistently moderate to high, particularly in areas such as supervisor respect (3.77), professional development (3.45) and DEI (3.32). Although most changes from 2024 are minimal, some areas—such as psychological safety (+0.24), respect (+0.34) and leadership communication (+0.34)—show early signs of a positive trajectory. Their responses suggest that onboarding and early engagement efforts are functioning well, but sustained attention is needed to maintain this outlook as they advance.
The 2025 climate survey results disaggregated by race and ethnicity reveal meaningful trends in how employees experience the college. Respondents identifying with underrepresented racial and ethnic groups—defined here to include American Indian or Alaska Native, Asian, Black or African American, Native Hawaiian or Pacific Islander, and those selecting “Other”—reported consistently more positive perceptions across nearly all survey items. Year-over-year improvements were particularly strong in DEI engagement, feeling safe to speak up, supervisor respect and being treated with dignity and respect, with gains of 0.4 or more in each area. These results indicate that recent efforts to build a more inclusive environment are resonating with employees who have historically experienced exclusion in academic settings.
Respondents in the majority group also reported improvement, but at a more modest rate. Gains were noted in leadership communication, pride in the college and supervisor respect, but perceptions of voice, recognition and inclusion in decisions improved only slightly. While this group’s baseline scores were already higher in several areas, the slower rate of change suggests future engagement strategies should continue to focus on expanding access to opportunity and representation across all employee populations.
The comparison of climate survey results by employment status highlights a clear divergence in experience. Full-time employees reported broad improvement across almost every item, including notable gains in supervisor respect (+0.36), professional development (+0.38) and DEI engagement (+0.28). These scores point to a workplace that is becoming more supportive and inclusive for those embedded more fully in the institution. By contrast, part-time employees saw year-over-year declines in 13 of 17 items, most notably in being able to be oneself (-0.41), DEI engagement (-0.4), recognition (-0.33) and voice in decisions (-0.28). These findings suggest that part-time employees may not be experiencing the same cultural improvements as their full-time colleagues, signaling a need to examine equity and belonging across employment classifications.
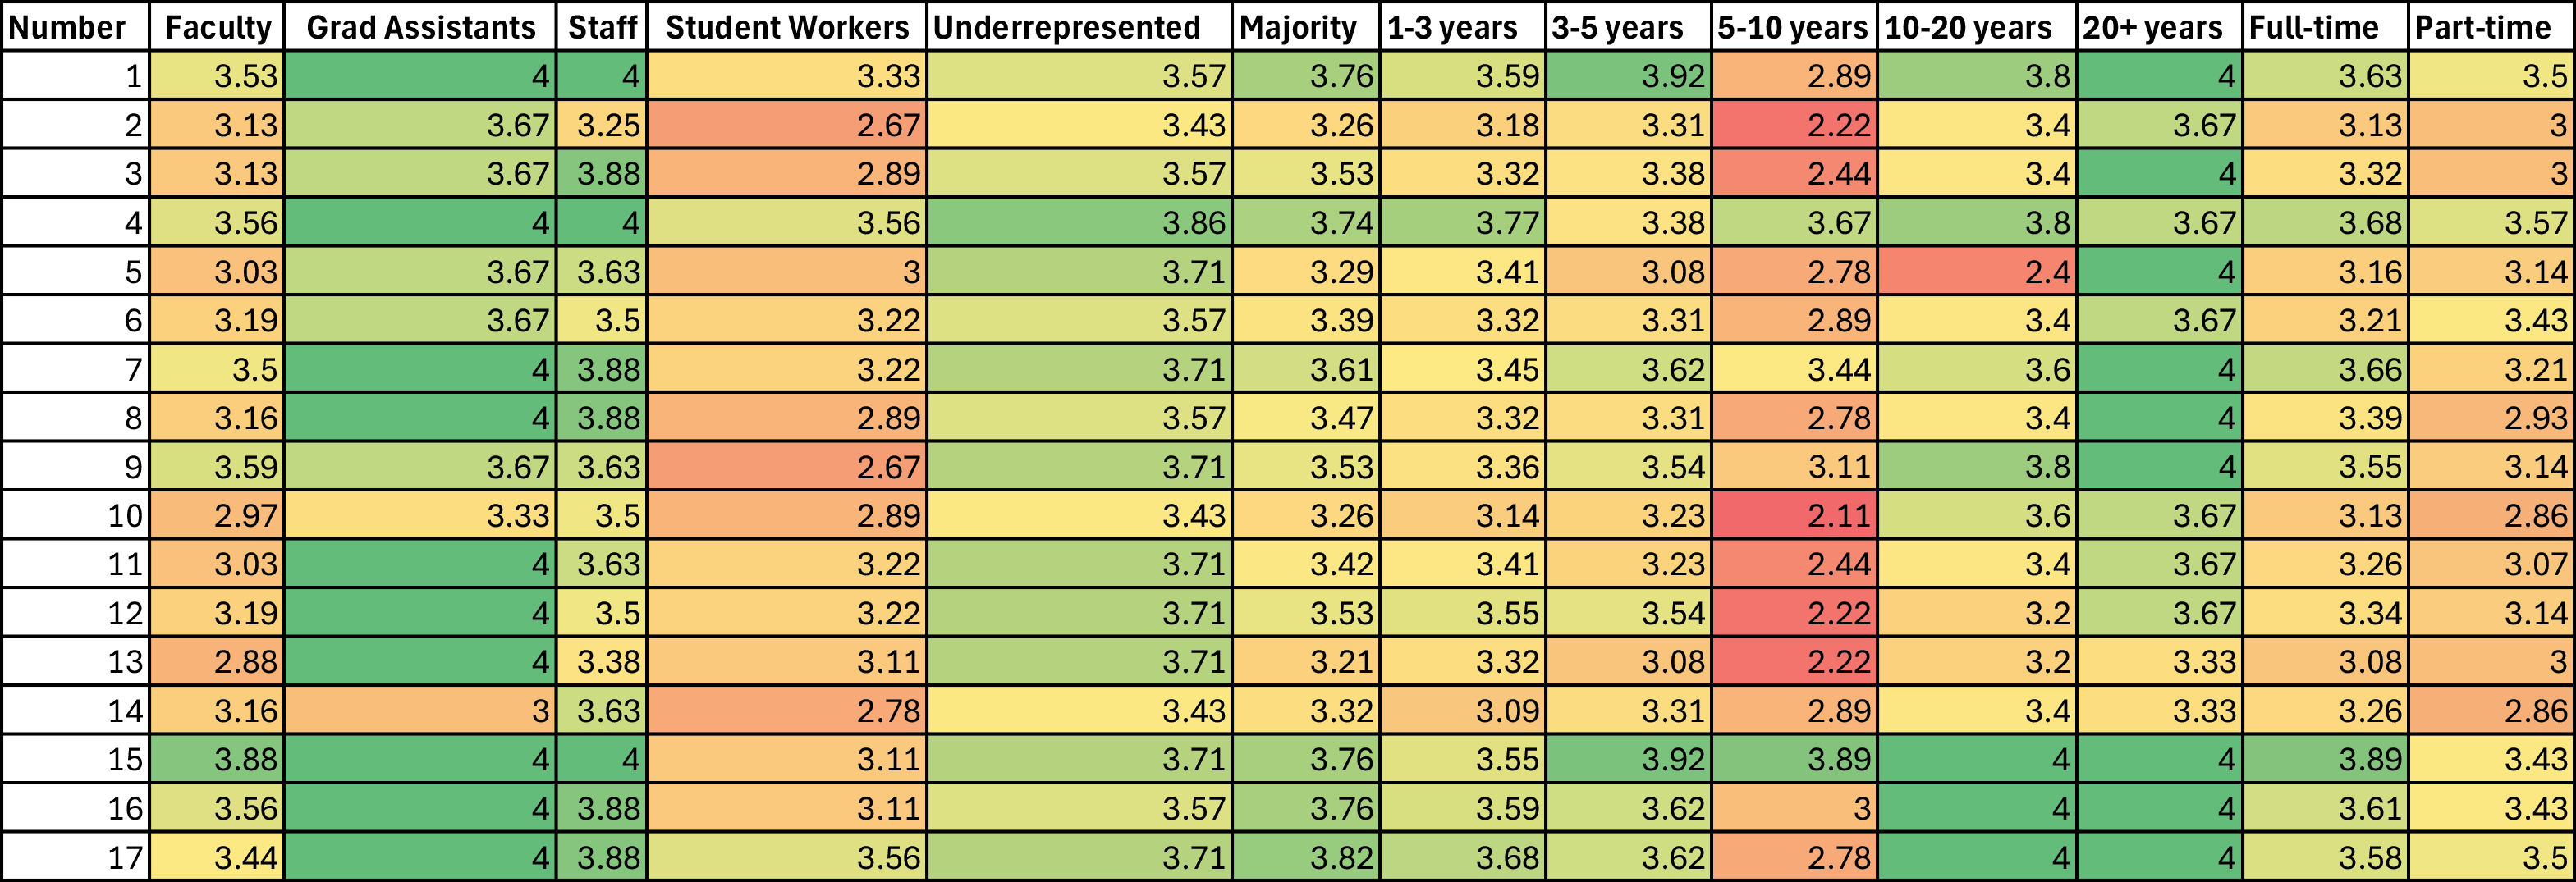
2025 Climate Survey Average Scores
The 2025 climate survey tells a story of institutional momentum. The college is making measurable progress in areas that matter most—mission clarity, supervisor support, leadership communication and professional development. These wins provide a blueprint for success and evidence of what’s possible when values align with action. At the same time, persistent gaps in voice, inclusion and equity of experience remain. These results offer a foundation from which to ask deeper questions and pursue more targeted solutions.
Guide to the measures
| Measure | Number |
| I understand how my work impacts the success of the college in achieving positive results. | 1 |
| People here are open to trying new and different ways of addressing our college's challenges. | 2 |
| I feel my personal contributions are recognized. | 3 |
| My supervisor treats me with respect. | 4 |
| The college promotes an environment of physical, mental, and social well-being. | 5 |
| There is good cooperation between employees in the college. | 6 |
| I feel my professional development is supported and encouraged. | 7 |
| I feel that training and engagement for diversity equity and inclusion are supported and encouraged. | 8 |
| I feel opportunities for improving course management and course grading via canvas and other applications is supported and encouraged. | 9 |
| I believe my opinions and perspectives are represented in decisions made. | 10 |
| I can be myself at this organization without worrying about how I will be accepted. | 11 |
| Employees in the college are treated with dginity and respect, regardless of their position or background. | 12 |
| Most of the time it is safe to speak up in the college. | 13 |
| I am satisfied with my involvement in decisions that affect my work. | 14 |
| I believe my work positively impacts the success of our students, faculty, and staff. | 15 |
| I am proud to be associated with the college and university. | 16 |
| Leadership in the college has adequately communicated the organization's long-range goals and strategic direction. | 17 |