As summer comes to a close and new student enrollment finalizes, we now have a clearer picture of our incoming first-year class for Fall 2024. While official recruitment numbers will be confirmed on the University Census date (the sixth day of classes), the current data provides a strong indication of where we stand this fall.
All figures in this report are as of August 5, 2024, compared to the same date in 2023.
College of Journalism and Mass Communications
The College of Journalism and Mass Communications has seen growth at every stage of the recruitment funnel, including applications, admissions, and enrollment deposits. Despite a slight decline in applications university-wide, strategic efforts to yield students have resulted in modest gains in both admitted students and enrollment deposits.
College of Journalism and Mass Communications | University of Nebraska-Lincoln | |||||||
2024 | 2023 | % Increase | 2024 | 2023 | % Increase | |||
| Applied | 553 | 524 | 5.5% | Applied | 17860 | 18335 | -2.6% | |
| Admitted | 503 | 478 | 5.2% | Admitted | 15604 | 15135 | 3.1% | |
| Enrollment Deposit | 213 | 183 | 16.4% | Enrollment Deposit | 4813 | 4767 | 1.0% | |
The college's impressive 16.4% increase in enrollment deposits has secured 213 incoming freshmen, setting a new record for the largest incoming class in the college’s history.
Residency
The College is proud to welcome a geographically diverse incoming class, with 30% of freshmen coming from out-of-state, significantly higher than the university's overall 23.4%. While the university has attracted international students, representing 1.5% of the incoming freshmen, the College will not enroll any international freshmen this fall.
Our new students hail from 21 different states, with the largest group (148) from Nebraska. Illinois follows with 11 students, Minnesota with 9, Iowa with 8 and Texas with 6.
Gender
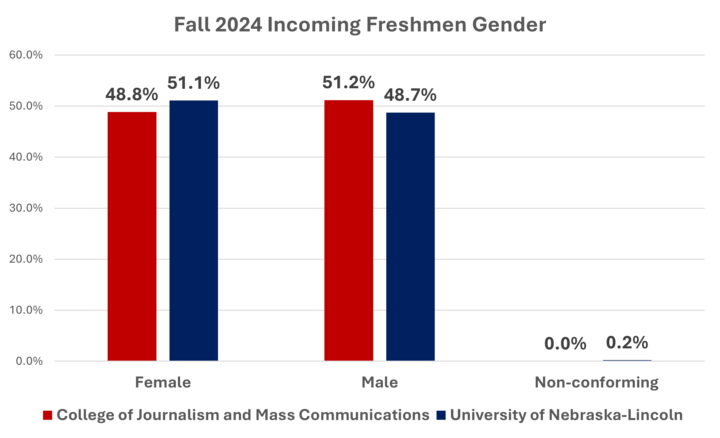
The College of Journalism and Mass Communications, historically female-dominated, saw a significant shift in gender balance from 2023 to 2024. While the total enrollment grew by 16.4%, the number of female students slightly increased from 103 to 104, but the percentage of the student body decreased from 56.3% to 48.8%. Conversely, male students increased significantly from 80 to 109, raising their representation from 43.7% to 51.2%.
The university-wide data shows a slight overall enrollment increase of 1.0%. Female students decreased in number and percentage, from 2507 (52.6%) to 2458 (51.1%). Male students increased from 2249 (47.2%) to 2345 (48.7%). Non-conforming students remained a very small and stable demographic, with a slight decrease from 11 to 10. Overall, while the College of Journalism and Mass Communications is becoming more gender-balanced, the university maintains a slight female majority.
College of Journalism and Mass Communications | University of Nebraska-Lincoln | |||||
2024 | 2023 | 2024 | 2023 | |||
| Female | 104 | 103 | Female | 2458 | 2507 | |
| Male | 109 | 80 | Male | 2345 | 2249 | |
| Non-conforming | 0 | 0 | Non-conforming | 10 | 11 | |
| Total | 213 | 183 | Total | 4813 | 4767 | |
First-generation Students
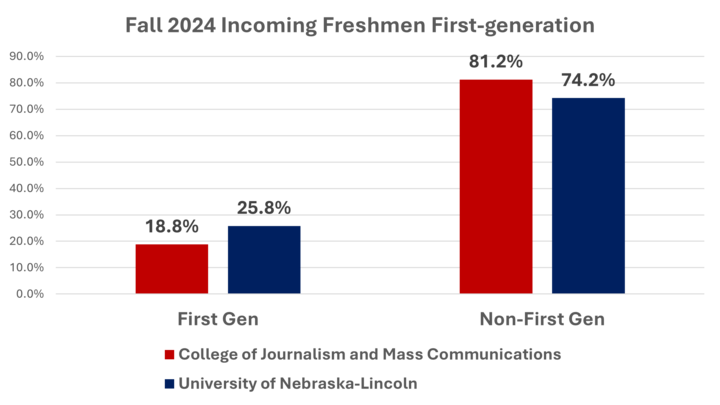
The College of Journalism and Mass Communications saw a 16.4% increase in total enrollment from 2023 to 2024, but the number of first-generation students decreased from 42 to 40, dropping their representation from 23.0% to 18.8%. In contrast, the University of Nebraska-Lincoln experienced a modest overall enrollment increase of 1.0%, with the number of first-generation students rising from 1200 to 1242, slightly increasing their representation from 25.2% to 25.8%. While the university managed to increase both the number and percentage of first-generation students, the College of Journalism and Mass Communications saw a decrease in both, indicating a diverging trend in supporting first-generation students within the college compared to the broader university.
College of Journalism and Mass Communications | University of Nebraska-Lincoln | |||||
2024 | 2023 | 2024 | 2023 | |||
| First Gen | 40 | 42 | First Gen | 1242 | 1200 | |
| Non-First Gen | 173 | 141 | Non-First Gen | 3571 | 3567 | |
| Total | 213 | 183 | Total | 4813 | 4767 | |
Race/Ethnicity
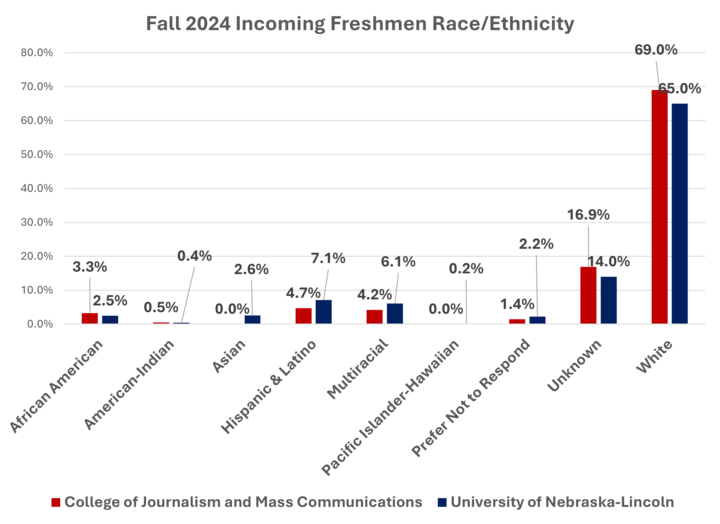
Overall, the College of Journalism and Mass Communications experienced an increase in total enrollment, with notable rises in African American and white students. However, there was a decline in Asian and Hispanic & Latino students and an increase in students with unknown ethnicity, complicating diversity assessments. Comparing the College to the university-wide data reveals several differences and similarities. The College's African American representation doubled, while the university's saw a modest rise. Both entities experienced a decrease in Asian students, but the College had none in 2024. Hispanic & Latino representation declined slightly in the College but remained stable university-wide. Multiracial students decreased in the College but increased across the university. Both had more students preferring not to respond and those with unknown ethnicity, with a sharper increase in the College. The percentage of white students rose in the College but slightly decreased at the university level. These trends indicate that while both strive for diversity, the College faces more significant demographic shifts.
College of Journalism and Mass Communications | University of Nebraska-Lincoln | |||||||||
2024 | 2023 | 2024 | 2023 | 2024 | 2023 | 2024 | 2023 | |||
| African American | 7 | 3 | 3.3% | 1.6% | African American | 118 | 110 | 2.5% | 2.3% | |
| American-Indian | 1 | 2 | 0.5% | 1.1% | American-Indian | 20 | 18 | 0.4% | 0.4% | |
| Asian | 6 | 0.0% | 3.3% | Asian | 123 | 211 | 2.6% | 4.4% | ||
| Hispanic & Latino | 10 | 12 | 4.7% | 6.6% | Hispanic & Latino | 343 | 342 | 7.1% | 7.2% | |
| Multiracial | 9 | 11 | 4.2% | 6.0% | Multiracial | 294 | 222 | 6.1% | 4.7% | |
| Pacific Islander-Hawaiian | 0.0% | 0.0% | Pacific Islander-Hawaiian | 8 | 5 | 0.2% | 0.1% | |||
| Prefer Not to Respond | 3 | 2 | 1.4% | 1.1% | Prefer Not to Respond | 106 | 73 | 2.2% | 1.5% | |
| Unknown | 36 | 25 | 16.9% | 13.7% | Unknown | 673 | 580 | 14.0% | 12.2% | |
| White | 147 | 122 | 69.0% | 66.7% | White | 3,126 | 3,205 | 65.0% | 67.2% | |
| Grand Total | 213 | 183 | 100.0% | 100.0% | Grand Total | 4,811 | 4,766 | 100% | 100% | |
Feeder High Schools
All the college’s feeder high schools continue to be in Nebraska, although surprisingly, two schools—Kearney High School and Aurora High School—are located outside the Lincoln and Omaha metro areas, indicating we may be seeing a slight demographic shift west.
- Kearney High – 6
- Millard North High – 6
- Papillion-La Vista High – 6
- Papillion-La Vista South High – 5
- Millard West High – 5
- Omaha North High Magnet – 5
- Lincoln Southeast High – 5
- Skutt Catholic High – 5
- Aurora High – 4
- Lincoln Southwest High – 4
- Burke High – 4
- Central High – 4
Competitors
A review of students admitted to the College of Journalism and Mass Communications for fall 2023 who chose to enroll elsewhere reveals that our biggest competitors are the University of Nebraska at Omaha (UNO) and the University of Missouri-Columbia. For fall 2023, 250 students were admitted to CoJMC but ultimately enrolled at other institutions.
For Nebraska students, the most significant competitor is UNO, which attracted 18 students, followed by the University of Nebraska at Kearney (UNK) with 11 students.
For nonresident students, the University of Missouri-Columbia stands out as the top competitor, enrolling 14 students primarily from Illinois, Iowa and Texas. Additionally, the University of Kansas is a notable competitor for both Nebraska and nonresident students, enrolling 16 overall.
Top Competitors
- University of Missouri – 21
- University of Nebraska Omaha – 19
- University of Kansas – 16
- University of Nebraska at Kearney – 11
By Major
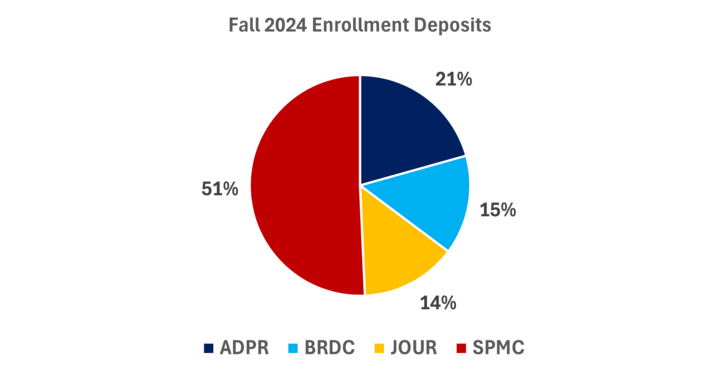
Next, we will examine our incoming freshmen class by major. More than 50% of our incoming students are sports media and communication majors, with the other majors splitting the remaining 50%.
Advertising and Public Relations
The advertising and public relations major saw an increase in the number of students who applied and were admitted to the college. However, we experienced a slight decline (1) in students who paid their enrollment deposit. The college’s overall growth in incoming freshmen was not driven by advertising and public relations.
Advertising and Public Relations Major | |||
2024 | 2023 | % Increase | |
| Applied | 70 | 57 | 22.8% |
| Admitted | 76 | 70 | 8.6% |
| Enrollment Deposit | 44 | 45 | -2.2% |
Residency
Overall, while the total number of students in the ADPR major remained steady, there was a notable shift, with a slight decrease in the proportion of resident students and an increase in the proportion of non-resident students. This trend suggests a growing geographical diversity among the incoming freshmen in this major.
| ADPR | 2024 | 2023 | 2024 | 2023 |
| Resident | 35 | 37 | 79.5% | 84.1% |
| Non-Resident | 9 | 7 | 20.5% | 15.9% |
| International | 0 | 0 | 0.0% | 0.0% |
| Total | 44 | 44 | 100.0% | 100.0% |
Incoming freshmen in advertising and public relations hail from seven states, with only Nebraska (35), Iowa (3) and North Dakota (2) enrolling more than one.
Gender
In the ADPR major, the overall number of incoming freshmen saw a minor decrease from 45 in 2023 to 44 in 2024. The gender distribution highlights some shifts: the number of female students decreased by 5, from 39 in 2023 to 34 in 2024, while the number of male students increased by 4, from 6 in 2023 to 10 in 2024. There were no non-conforming students in either year. These changes indicate a slight shift towards a more balanced gender distribution, with a decrease in female representation and an increase in male representation among the incoming freshmen in the ADPR major.
| ADPR | 2024 | 2023 |
| Female | 34 | 39 |
| Male | 10 | 6 |
| Non-conforming | ||
| Total | 44 | 45 |
First-generation Students
The data on first-generation students in the ADPR major shows a slight shift between 2023 and 2024. In 2023, there were 11 first-generation students, which decreased to 8 in 2024. Conversely, the number of non-first-generation students increased from 34 in 2023 to 36 in 2024. Overall, the total number of students in the ADPR major saw a minor decrease from 45 in 2023 to 44 in 2024. This indicates a reduction in the proportion of first-generation students and a corresponding increase in non-first-generation students within the ADPR major over this period.
| ADPR | 2024 | 2023 |
| First Gen | 8 | 11 |
| Non-First Gen | 36 | 34 |
| Total | 44 | 45 |
Race/Ethnicity
The data on the race and ethnicity of ADPR students shows some variation between 2023 and 2024. In 2023, the student body included 2 African American students, while there were none reported in 2024. The number of Hispanic & Latino students decreased from 3 in 2023 to 2 in 2024. Conversely, the number of multiracial students increased from 2 in 2023 to 3 in 2024. The category of students with unknown race/ethnicity saw a decrease from 6 in 2023 to 3 in 2024. The number of White students increased from 32 in 2023 to 36 in 2024. There were no students reported as American-Indian, Asian, Pacific Islander-Hawaiian, or in the 'Prefer Not to Respond' category in either year. Overall, the total number of students slightly decreased from 45 in 2023 to 44 in 2024. This indicates a trend toward a higher percentage of White students and a slight reduction in the diversity of racial and ethnic backgrounds among ADPR students over the period.
| ADPR | 2024 | 2023 |
| African American | 2 | |
| American-Indian | ||
| Asian | ||
| Hispanic & Latino | 2 | 3 |
| Multiracial | 3 | 2 |
| Pacific Islander-Hawaiian | ||
| Prefer Not to Respond | ||
| Unknown | 3 | 6 |
| White | 36 | 32 |
| Grand Total | 44 | 45 |
Feeder High Schools
The top feeder high schools are split between two schools in the Omaha area and two schools in central Nebraska. The largest feeder schools are:
- Papillion-La Vista High – 3
- Aurora High – 3
- Kearney High – 3
- Millard North High - 2
Competitor Programs
A review of clearing house data, which shows where students, who were admitted to APDR in fall 2023 ultimately enrolled, provides insight into the competitive landscape for the ADPR major.
Out of the 24 students who were admitted to the ADPR program but enrolled elsewhere, the majority, 10 students, were from Nebraska. Other states represented include Illinois (3 students), Iowa (2 students), Kansas (2 students), North Dakota, California, Colorado, Florida, Michigan, Minnesota, and New York, each with one student.
Top Competitors:
- University of Nebraska at Omaha – 3
- University of Kansas – 3
- University of Kentucky – 2
The majority of students who chose other institutions were from Nebraska, indicating strong local competition. The University of Nebraska at Omaha and other in-state institutions like Doane University, Nebraska Wesleyan University, and the University of Nebraska at Kearney attracted these students.
Institutions like the University of Kansas and the University of Kentucky drew students from neighboring states and further afield. Prestigious universities such as Boston University and Indiana University Bloomington also attracted individual students.
The data suggests that while Nebraska remains a significant feeder state for the ADPR program, competition from both local and out-of-state institutions is strong. The University of Nebraska at Omaha, in particular, appears to be a notable competitor, along with other prominent universities across the country.
Broadcasting
Broadcasting saw decreases in the number of applicants and admitted students for fall 2023. However, college yield efforts in the spring and summer resulted in an increase of 19.2% in the total number of enrollment deposits paid.
| BRDC | 2024 | 2023 | % Increase |
| Applied | 57 | 66 | -13.6% |
| Admitted | 59 | 64 | -7.8% |
| Enrollment Deposit | 31 | 26 | 19.2% |
Residency
Broadcasting attracted a significant proportion of out-of-state students, with 41.9% of the incoming class being nonresident students. This is a significant increase from the proportion of nonresident students in 2023, which was 19.2%.
| BRDC | 2024 | 2023 | 2024 | 2023 |
| Resident | 18 | 21 | 58.1% | 80.8% |
| Non-Resident | 13 | 5 | 41.9% | 19.2% |
| International | 0 | 0 | 0.0% | 0.0% |
| Total | 31 | 26 | 100.0% | 100.0% |
Incoming broadcasting students hail from 11 states, with the majority from Nebraska (18) and only one other state, Illinois (4), providing more than one student.
Gender
The number of female students remained constant at 12 for both years, while the number of male students rose from 14 in 2023 to 19 in 2024. No non-conforming students were reported in either year. This increase in total enrollment is driven by a significant rise in male students, shifting the gender balance more towards male representation.
| BRDC | 2024 | 2023 |
| Female | 12 | 12 |
| Male | 19 | 14 |
| Non-conforming | ||
| Total | 31 | 26 |
First-generation students
The data on the distribution of first-generation and non-first-generation students in the Broadcasting (BRDC) major for 2023 and 2024 shows that the number of first-generation students remained constant at 7 for both years. Meanwhile, the number of non-first-generation students increased from 19 in 2023 to 24 in 2024. This increase in non-first-generation students indicates a trend towards a higher proportion of students with familial experience in higher education within the BRDC major.
| BRDC | 2024 | 2023 |
| First Gen | 7 | 7 |
| Non-First Gen | 24 | 19 |
| Total | 31 | 26 |
Race/Ethnicity
The data on the race and ethnicity of broadcasting students for 2023 and 2024 shows several changes in the student body composition. In 2024, there were 2 African American students, whereas there were none in 2023. The number of Hispanic & Latino students remained constant at 2 for both years. There were no Asian students in 2024, down from 2 in 2023. The number of multiracial students in 2024 was 1, with none reported in 2023. The category for students who preferred not to respond was present only in 2023, with 1 student. The number of students with unknown race/ethnicity increased from 4 in 2023 to 6 in 2024. The number of white students increased from 17 in 2023 to 20 in 2024. Overall, the total number of students in the BRDC major increased from 26 in 2023 to 31 in 2024. The overall proportion of diverse (not white) students in the broadcasting major slightly increased from 34.6% in 2023 to 35.5% in 2024, indicating a trend towards greater diversity.
| BRDC | 2024 | 2023 |
| African American | 2 | |
| Asian | 2 | |
| Hispanic & Latino | 2 | 2 |
| Multiracial | 1 | |
| Prefer Not to Respond |
| 1 |
| Unknown | 6 | 4 |
| White | 20 | 17 |
| Grand Total | 31 | 26 |
Feeder Schools
The top feeder high schools are split between a school in the Omaha area and one school in central Nebraska. The largest feeder schools are:
- Omaha North Magnet – 4
- Kearney High – 3
Competitor Programs
A review of clearinghouse data, which tracks the final enrollment choices of students admitted to the BRDC program in fall 2023, offers valuable insights into the competitive landscape for the ADPR major. Among the 29 students who were admitted to the BRDC program but ultimately enrolled elsewhere, a significant number, six students, were from Nebraska. The remaining students were distributed across several other states: Kansas (5 students), California (4 students), Illinois (3 students), Texas (3 students), Michigan (2 students), and one student each from Colorado, Iowa, Minnesota, Missouri, Pennsylvania, and Tennessee.
Top Competitors:
- University of Kansas – 3 students
- University of Missouri – 3 students
- University of Nebraska at Omaha – 2 students
This data reveals that the majority of students who opted for other institutions were from out of state, highlighting that while local competition is relatively minimal, there is stronger competition at the regional and national levels for students interested in this major. Institutions such as the University of Kansas and the University of Missouri have attracted students not only from neighboring states but also from across the country.
Journalism
The journalism major saw declines in applications and admitted students for fall 2024. However, enrollment deposits remained flat, likely bolstered by spring yield efforts undertaken by both the university and the college.
| JOUR | 2024 | 2023 | % Increase |
| Applied | 131 | 145 | -9.7% |
| Admitted | 100 | 119 | -16.0% |
| Enrollment Deposit | 30 | 30 | 0.0% |
Residency
The proportion of journalism majors' who are out-of-state students declined slightly in fall 2024, from 30% to 26.7%, but it remains greater than the university’s proportion of 23.4%.
| JOUR | 2024 | 2023 | 2024 | 2023 |
| Resident | 22 | 21 | 73.3% | 70.0% |
| Non-Resident | 8 | 9 | 26.7% | 30.0% |
| International | 0.0% | 0.0% | ||
| Total | 30 | 30 | 100.0% | 100.0% |
Students hailed from seven states, with the majority from Nebraska (24) and only one other state, Illinois (2), providing more than one student.
Gender
For the fall 2024 semester, the number of male students grew by 2, while the number of female students declined by 2. Despite this shift toward more male students, the incoming class in journalism remains predominantly female, at 73.3%.
| JOUR | 2024 | 2023 |
| Female | 20 | 22 |
| Male | 10 | 8 |
| Non-conforming | ||
| Total | 30 | 30 |
First-generation
The data on the distribution of first-generation students shows a decline between 2023 and 2024. This year, only 16.6% of incoming journalism majors identified as first-generation, compared to 26.6% last year.
| JOUR | 2024 | 2023 |
| First Gen | 5 | 8 |
| Non-First Gen | 25 | 22 |
| Total | 30 | 30 |
Race/Ethnicity
The most notable change is in the number of students identifying as "Unknown," which doubled from 3 in 2023 to 6 in 2024. The number of White students saw a slight increase from 21 to 23. The representation of Multiracial students remained consistent, with one student each year. However, there is no representation of African American, American-Indian, Asian, Hispanic & Latino, or those preferring not to respond in 2024, indicating either a lack of diversity or a higher number of students choosing not to disclose their ethnicity in the 2024 cohort compared to the previous year. This suggests a potential area for further exploration and targeted recruitment efforts to enhance diversity in the program.
| JOUR | 2024 | 2023 |
| African American | ||
| American-Indian | 1 | |
| Asian | 2 | |
| Hispanic & Latino | 2 | |
| Multiracial | 1 | 1 |
| Prefer Not to Respond | ||
| Unknown | 6 | 3 |
| White | 23 | 21 |
Feeder Schools
Journalism’s feeder schools are all located in the Omaha metro area. The top feeder schools are:
- Millard West High – 3
- Burke High – 2
- Creighton Prep – 2
Competitor Schools
The data on lost applicants, those admitted to the journalism major at UNL for fall 2023 but ultimately enrolled elsewhere, highlights key competitive trends and geographical distribution. A total of 77 students enrolled at other institutions, with a significant portion coming from Nebraska (26 students), followed by Texas (11 students) and Illinois (10 students). The University of Missouri-Columbia attracted the most students, drawing 11 applicants, primarily from Nebraska and Texas. The University of Nebraska at Omaha also secured a substantial number of these students, with eight enrolling there, mostly from within Nebraska. Other notable competitors include the University of Kansas and the University of Iowa, which attracted 6 and 3 students, respectively.
The top competitors were:
- University of Missouri – Columbia – 11
- University of Nebraska at Omaha – 8
- University of Kansas – 6
- University of Iowa – 3
- University of Nebraska at Kearney - 3
This data indicates that local competitors like the University of Nebraska at Omaha are strong contenders, especially for in-state students, while out-of-state institutions such as the University of Missouri and the University of Kansas are drawing students from a broader regional pool. This trend suggests a need for strategic efforts to retain in-state students and appeal to those considering out-of-state options.
Sports Media and Communication
The sports media and communication major saw significant increases across the recruitment funnel, with the largest increase in enrollment deposits paid at 31.7%.
| SPMC | 2024 | 2023 | % Increase |
| Applied | 295 | 256 | 15.2% |
| Admitted | 268 | 225 | 19.1% |
| Enrollment Deposit | 108 | 82 | 31.7% |
Residency
The proportion of out-of-state students enrolling in the SPMC major declined from 43.2% in 2023 to 32.4% in 2024 but remains significantly above the university-wide proportion of 23.4%.
| SPMC | 2024 | 2023 | 2024 | 2023 |
| Resident | 73 | 46 | 67.6% | 56.8% |
| Non-Resident | 35 | 35 | 32.4% | 43.2% |
| International | 0.0% | 0.0% | ||
| Total | 108 | 81 | 100.0% | 100.0% |
Students hail from 15 states, with a majority from Nebraska (72), followed by Minnesota (7), Colorado (4), Texas (4), Connecticut (2), Missouri (2), Pennsylvania (2), California (2) and Iowa (2). The remaining states each provided one student, including North Dakota, South Carolina, Kansas, Kentucky and Maryland.
Gender
The male student population saw the most significant growth, increasing from 52 in 2023 to 70 in 2024. Female enrollment also rose, from 30 in 2023 to 38 in 2024. However, no students identified as non-conforming in either year. This trend indicates a growing interest in the SPMC major, particularly among male students, while female participation has also seen a healthy increase.
| SPMC | 2024 | 2023 |
| Female | 38 | 30 |
| Male | 70 | 52 |
| Non-conforming | ||
| Total | 108 | 82 |
Frist-generation Students
The proportion of first-generation students fell from 19.5% in 2023 to 18.5% in 2024, which is slightly lower than the college’s proportion of 18.7% and significantly lower than the university's proportion of 25.8%.
| SPMC | 2024 | 2023 |
| First Gen | 20 | 16 |
| Non-First Gen | 88 | 66 |
| Total | 108 | 82 |
Race/Ethnicity
The number of African American students has significantly increased from 1 to 5. Hispanic & Latino representation also grew, rising from 5 to 7 students. However, the number of Multiracial students decreased from 8 in 2023 to 3 in 2024. The Asian student population dropped from 2 in 2023 to none in 2024, and there was no representation of Pacific Islander-Hawaiian students in either year. The category of students choosing not to disclose their race or ethnicity ("Unknown") saw a substantial increase, from 12 in 2023 to 22 in 2024. White students continue to make up the majority of the SPMC major, with their numbers increasing from 52 to 68. This data suggests an overall growth in diversity within the program, though certain groups like Multiracial and Asian students have seen a decline, and the significant rise in "Unknown" responses could indicate a trend toward non-disclosure or a need for further demographic clarification.
| SPMC | 2024 | 2023 |
| African American | 5 | 1 |
| American-Indian | 1 | 1 |
| Asian | 2 | |
| Hispanic & Latino | 7 | 5 |
| Multiracial | 3 | 8 |
| Pacific Islander-Hawaiian | ||
| Prefer Not to Respond | 3 | 1 |
| Unknown | 22 | 12 |
| White | 67 | 52 |
Feeder Schools
SPMC feeder schools are concentrated in the Omaha metro area, with more than 11 schools providing more than one student. The top three schools were:
- Papillion-La Vista – 4
- Skutt Catholic – 4
- Millard North – 2
The SPMC major was the only major where an out-of-state high school contributed more than one student. Minnetonka High School in Minnesota contributed two.
Competitor Schools
The data on lost applicants for the Sports Media and Communication (SPMC) major at UNL for fall 2023 shows that 120 students admitted to the program ultimately enrolled elsewhere. Most of these students, 34 in total, were from Nebraska, indicating strong local competition. Illinois and Texas were also significant sources of lost students, with 19 and 11 students, respectively, choosing other institutions. The University of Nebraska at Kearney and the University of Missouri-Columbia each attracted seven students, making them the top competitors. Other notable institutions include Arizona State University, Indiana University Bloomington, and the University of Kansas, each drawing multiple students.
Top Competitors
- University of Nebraska at Kearny – 7
- University or Missouri – 7
- University of Nebraska at Omaha - 5
- Arizona State University – 4
- Indiana University Bloomington – 4
- University of Kansas – 4
The data suggests that regional universities, particularly those within Nebraska and neighboring states, pose a significant competitive threat to UNL's SPMC program.
Recruitment Snapshot
| Recruitment Snapshot | UNL | CoJMC | ADPR | BRDC | JOUR | SPMC |
| Growth in Applications | -2.6% | 5.5% | 22.8% | -13.6% | -9.7% | 15.2% |
| Growth in Admits | 3.1% | 5.2% | 8.6% | -7.8% | -16.0% | 19.1% |
| Growth in Enrollment Deposits | 1.0% | 16.4% | -2.2% | 19.2% | 0.0% | 31.7% |
| Proportion of Out-of-State Students | 30.5% | 23.4% | 20.5% | 41.9% | 26.7% | 32.4% |
| Promotion of Male Students | 48.7% | 51.1% | 22.7% | 38.7% | 33.3% | 64.8% |
| Proportion of First-Gen Students | 25.8% | 18.7% | 18.1% | 22.5% | 16.6% | 19.5% |
| Proportion of White Students | 64.9% | 69.0% | 81.8% | 65.5% | 76.6% | 62.0% |
| Average ACT | NA | 23.2 | 22.9 | 22.8 | 25.3 | 22.8 |
| Average HS GPA | NA | 3.12 | 3.18 | 3.11 | 3.3 | 3.04 |


