Over the past five years, the College of Journalism and Mass Communications has graduated significantly more students than it enrolled as first-time freshmen, averaging 272 graduates annually compared to 171 new freshmen each fall. This growth is driven largely by internal transfers, students who begin their academic careers in other colleges at the University of Nebraska–Lincoln but find long-term academic and professional alignment in JMC. On average, 43 percent of JMC graduates started in a different college. Among the college’s four majors, Advertising and Public Relations is the strongest draw, with more than half of its graduates transferring into the program. The college also has the lowest student outflow of any academic college on campus, suggesting that students who start in JMC are likely to stay and complete their degrees. These trends highlight JMC’s role as both a stable academic home and a destination for students seeking a better fit, making it a key contributor to overall university retention and student success.
More Graduates Than Freshmen: Internal Transfers Fuel Growth
Over the past five years, the College of Journalism and Mass Communications has welcomed an average of 171 first-time freshmen each fall semester.
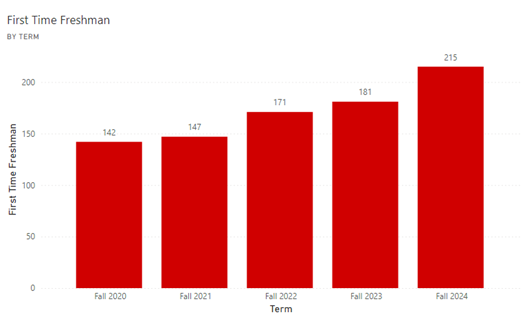
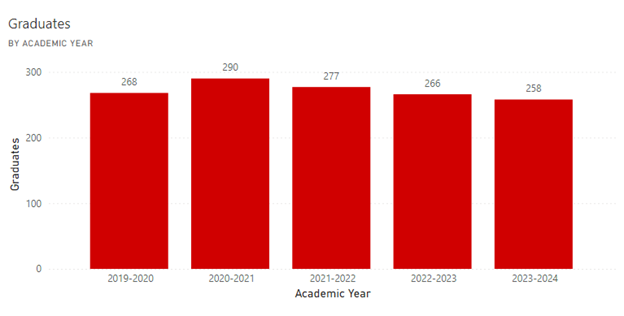
However, the average size of our graduating classes over the same period is significantly larger, at 272 students per year. This consistent growth indicates that our student population increases as students progress through the program, largely due to transfers from other colleges within the university or from external institutions.
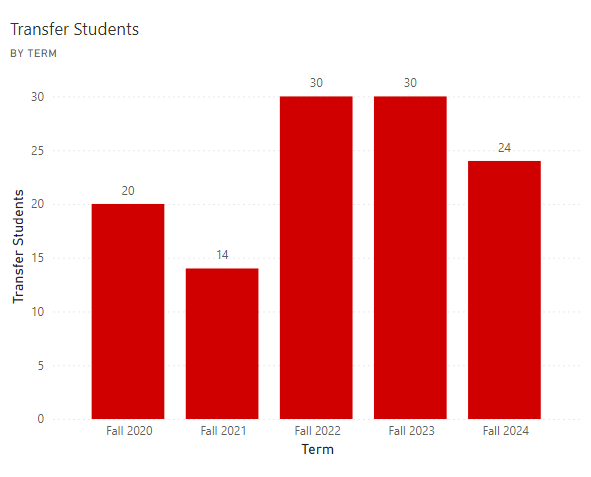
This growth is driven by both internal and external transfers. On average, the college admits 24 students each year who transfer from other institutions. The majority of enrollment growth, however, comes from within the University of Nebraska–Lincoln.
Where JMC Graduates Started
An analysis of graduation data reveals that, on average, 115 of JMC’s 272 graduates began their academic careers in the college. This means that approximately 43% of each graduating class initially enrolled in a different college at UNL. In fact, JMC graduates represent students who started their academic journey in every college at the university.
JMC Graduates | ||||
| Starting College | 2020-2021 | 2021-2022 | 2022-2023 | 2023-2024 |
| ANR | 3 | 7 | 2 | 4 |
| ARH | 3 | 4 | 3 | 4 |
| ASC | 22 | 23 | 17 | 26 |
| CBA | 64 | 35 | 42 | 29 |
| EHS | 16 | 16 | 12 | 12 |
| ENG | 4 | 3 | 1 | |
| FPA | 6 | 11 | 2 | 6 |
| GEN | 56 | 62 | 49 | 48 |
| JMC | 107 | 108 | 131 | 122 |
| PAC | 2 | 1 | 2 | 1 |
| VST | 7 | 10 | 3 | 3 |
| (blank) | 2 | |||
| Total | 290 | 277 | 266 | 258 |
Top Internal Feeder Programs to JMC
The largest internal feeder programs to JMC include:
- The Explore Center (GEN), with an average of 56 graduates per year
- The College of Business (CBA), with an average of 41 graduates per year
- The College of Arts and Sciences (ASC), with an average of 23 graduates per year
This transfer activity underscores the cross-disciplinary appeal of journalism, advertising and public relations, broadcasting and sports media and communication, and it highlights the college’s key role in supporting students’ academic discovery and long-term success.
Student Flow on Campus
Student Outflow: Where Students Leave
Each year, a number of students begin their academic careers in one college at the University of Nebraska–Lincoln but graduate from another. This movement reflects how students explore and adjust their academic paths over time.
The table shows the number of graduates who left their starting college before earning their degree from 2018–2019 through 2023–2024. The Explore Center is not included, as transferring out is the intended outcome for those students.
This analysis includes only students who completed a degree. It does not capture students who left the university before graduating.
Graduates who left their starting college | |||||
| Starting College | 2019-2020 | 2020-2021 | 2021-2022 | 2022-2023 | 2023-2024 |
| ANR | 69 | 63 | 57 | 55 | 48 |
| ARH | 29 | 29 | 27 | 25 | 17 |
| ASC | 180 | 176 | 179 | 151 | 163 |
| CBA | 143 | 170 | 137 | 131 | 108 |
| EHS | 106 | 81 | 74 | 77 | 70 |
| ENG | 138 | 124 | 131 | 110 | 102 |
| FPA | 24 | 32 | 45 | 31 | 31 |
| GEN | 912 | 875 | 724 | 794 | 730 |
| JMC | 43 | 27 | 30 | 36 | 36 |
The College of Arts and Sciences has the highest outflow, averaging 180 students per year. Business and Engineering follow, with average annual outflows of 142 and 118 students, respectively. Education and Human Sciences averages 85, and Agricultural Sciences and Natural Resources averages 61.
The College of Journalism and Mass Communications has the lowest outflow of any academic college, with an average of just 34 students per year. This suggests that students who start in JMC are likely to stay and complete their degrees there.
Outflow patterns vary across colleges, but the data highlights where students tend to leave and where they tend to stay. This information helps identify opportunities to strengthen student retention and support.
Student Inflow: Where Students Go
Just as it is important to understand where students leave, it is equally important to understand where they go. The table below shows the number of graduates each year who transferred into a college from another program and completed their degrees there.
These students represent successful internal transfers. They did not remain in their original academic college, but they stayed enrolled, found a better academic fit and graduated. This kind of movement reflects the university’s ability to help students adjust their academic paths without interrupting their progress toward a degree.
Graduates who transferred from another program | |||||
| Graduating College | 2019-2020 | 2020-2021 | 2021-2022 | 2022-2023 | 2023-2024 |
| ANR | 157 | 156 | 134 | 118 | 125 |
| ARH | 17 | 26 | 20 | 34 | 30 |
| ASC | 528 | 532 | 432 | 461 | 413 |
| CBA | 340 | 303 | 292 | 301 | 282 |
| EHS | 321 | 327 | 314 | 290 | 249 |
| ENG | 125 | 95 | 101 | 130 | 95 |
| FPA | 54 | 37 | 46 | 43 | 55 |
| JMC | 164 | 183 | 169 | 135 | 136 |
The College of Arts and Sciences consistently receives the largest number of internal transfers, with an average of 481 graduates per year who began in another college. Education and Human Sciences and Business also see high inflow, averaging 307 and 309 graduates per year, respectively.
The College of Journalism and Mass Communications averages 161 graduates per year who began in a different academic program. These students often find alignment with JMC’s focus on storytelling, media and communication after starting in another field. Their movement into the college underscores JMC’s role as a destination for students exploring new academic and career directions.
These inflow patterns highlight the colleges that serve as academic landing places for students seeking to change course. Understanding them helps identify where the university is succeeding in keeping students enrolled and on track to graduate.
Net Internal Transfers
The net internal transfer figure reflects the difference between the number of students who transferred into a college and the number who transferred out before graduation. This measure shows which colleges serve as destinations for students seeking a new academic path and which colleges lose more students than they receive.
The table below shows the net internal transfer values by academic year. Positive numbers indicate a net gain in students, while negative numbers reflect a net loss.
Net Transfers | |||||
| Graduating College | 2019-2020 | 2020-2021 | 2021-2022 | 2022-2023 | 2023-2024 |
| ANR | 88 | 93 | 77 | 63 | 77 |
| ARH | -12 | -3 | -7 | 9 | 13 |
| ASC | 348 | 356 | 253 | 310 | 250 |
| CBA | 197 | 133 | 155 | 170 | 174 |
| EHS | 215 | 246 | 240 | 213 | 179 |
| ENG | -13 | -29 | -30 | 20 | -7 |
| FPA | 30 | 5 | 1 | 12 | 24 |
| JMC | 121 | 156 | 139 | 99 | 100 |
The College of Arts and Sciences has the highest net gain over the six-year period, averaging 302 students per year. Education and Human Sciences and Business follow, each with consistent annual gains above 200 students. These colleges serve as academic landing places for students across campus.
The College of Journalism and Mass Communications also shows a strong and consistent net gain, averaging 126 students per year. While JMC is one of the university’s smaller colleges in terms of enrollment, its transfer gains are notable and reflect the college’s appeal to students who change direction mid-degree.
In contrast, colleges such as Architecture and Engineering report net losses in most years, indicating that more students leave than arrive. These trends may reflect program-specific challenges, limited flexibility or a mismatch between student expectations and academic structure.
Net Transfer Rate
Although raw transfer numbers offer insight into student movement, they do not account for differences in college size. Some colleges serve larger student populations and naturally experience more movement, while others are smaller but still have a meaningful impact.
Because academic colleges vary widely in size, raw transfer numbers can be misleading. A college with more students will naturally have higher transfer totals, regardless of whether its programs are attracting or losing students at a higher rate. To create a more meaningful comparison, we calculated a net transfer rate for each college.
The net transfer rate shows the proportion of a college’s graduates who represent a net gain from internal transfers. It is calculated by subtracting the number of students who left a college before graduation from the number who transferred in, and then dividing that difference by the total number of students who graduated from the college in a given year.
In simple terms:
Net Transfer Rate = (Transfers In) – (Transfers Out) / (Total Graduates from the College)
This allows us to compare how effectively each college attracts and retains students, regardless of its overall enrollment size.
A positive rate means more students transferred into the college than left it. A negative rate means the college lost more students than it gained. The higher the percentage, the more a college contributes to keeping students on track to graduate, even if those students began in a different academic program.
Net transfer rates provide a clearer view of how each college contributes to student retention and degree completion. These rates reflect the proportion of graduates who represent a net gain from internal transfers, offering a fair comparison across colleges of different sizes.
Net Transfer Rate | |||||
| Graduating College | 2019-2020 | 2020-2021 | 2021-2022 | 2022-2023 | 2023-2024 |
| ANR | 14.2% | 14.0% | 13.6% | 10.9% | 15.1% |
| ARH | -16.4% | -3.2% | -9.3% | 8.2% | 12.1% |
| ASC | 34.4% | 33.7% | 26.9% | 32.3% | 26.8% |
| CBA | 22.2% | 15.8% | 17.7% | 18.3% | 19.8% |
| EHS | 31.7% | 36.9% | 37.8% | 32.0% | 30.9% |
| ENG | -2.2% | -5.2% | -5.2% | 3.5% | -1.4% |
| FPA | 21.6% | 3.4% | 0.6% | 7.8% | 14.8% |
| JMC | 45.1% | 53.8% | 50.2% | 37.2% | 38.8% |
The College of Journalism and Mass Communications has the highest net transfer rate in every year of the analysis. From 2018–2019 through 2020–2021, its rate averaged more than 45 percent. This means that a large share of JMC graduates started in another academic college. The consistently high rates show JMC’s role as a destination for students who change direction and find long-term success in the college.
The College of Education and Human Sciences also performs well. Its net transfer rate ranges from 31 to 38 percent across all six years. This steady performance suggests that EHS attracts and supports a broad base of students, many of whom transfer in from other programs.
The College of Arts and Sciences maintains positive rates throughout the period, typically in the high 20s to low 30s. The size and diversity of its academic offerings may explain its ability to accommodate students from a variety of starting points.
The College of Business shows positive gains each year, with net transfer rates between 15 and 22 percent. While lower than JMC or EHS, the rates reflect consistent contributions to student retention.
Net transfer rates show more than movement. They highlight where students find the right fit and where colleges play a larger role in keeping students on track to graduate.
Flow by JMC Major
While overall college-level patterns are useful, transfer trends can vary significantly by major. The College of Journalism and Mass Communications offers four undergraduate majors: Advertising and Public Relations (ADPR), Broadcasting (BRDC), Journalism (JOUR), and Sports Media and Communication (SPMC). Each serves a distinct student population, and each shows different patterns of student movement.
The table below shows the number of graduates who began in each JMC major but completed their degrees in another college. Journalism has the highest average transfer-out rate, with 23 students per year leaving the major. ADPR follows with 13. BRDC and SPMC have smaller but consistent outflows, averaging 8 and 11 students per year.
Although most students who start in JMC stay through graduation, these figures suggest that some majors see more movement than others. Understanding where students leave can help target advising and support for those at greater risk of changing programs.
Graduated from a different major | |||||
| Starting Major | 2019-2020 | 2020-2021 | 2021-2022 | 2022-2023 | 2023-2024 |
| ADPR | 17 | 10 | 11 | 11 | 14 |
| BRDC | 17 | 9 | 3 | 5 | 7 |
| JOUR | 29 | 22 | 19 | 26 | 20 |
| SPMC | 4 | 7 | 14 | 17 | |
At the same time, JMC attracts a steady stream of internal transfers. The table below shows the number of students who transferred into each major after starting in a different academic program. ADPR leads, averaging 122 transfers per year. SPMC follows with 24, BRDC with 19, and JOUR with 12.
These inflows show that ADPR and SPMC have broad appeal among students exploring new paths, while BRDC and JOUR attract a smaller group of students with specific interests in media and journalism. In many cases, students who do not begin their academic careers in JMC ultimately find a long-term fit in one of these majors.
Transferred into Major | |||||
| Graduating Major | 2019-2020 | 2020-2021 | 2021-2022 | 2022-2023 | 2023-2024 |
| ADPR | 131 | 144 | 127 | 96 | 114 |
| BRDC | 22 | 18 | 18 | 20 | 15 |
| JOUR | 16 | 12 | 15 | 11 | 8 |
| SPMC | 17 | 29 | 23 | 30 | 21 |
To understand the net effect of these movements, the table below compares inflow and outflow to show net transfers by major. ADPR consistently posts the largest gains, averaging a net increase of 110 students per year. SPMC also sees positive gains every year, with peak performance in 2019–2020 and 2020–2021. BRDC shows smaller but steady gains. JOUR, by contrast, loses more students than it gains in every year of the analysis.
Net Transfers | |||||
| Graduating Major | 2019-2020 | 2020-2021 | 2021-2022 | 2022-2023 | 2023-2024 |
| ADPR | 114 | 134 | 116 | 85 | 100 |
| BRDC | 5 | 9 | 15 | 15 | 8 |
| JOUR | -13 | -10 | -4 | -15 | -12 |
| SPMC | 17 | 25 | 16 | 16 | 4 |
To account for program size, the table below shows the net transfer rate for each major, calculated as net transfers divided by the total number of graduates. ADPR maintains the highest rate, ranging from 65% to 74%. This means that more than half of ADPR graduates each year entered the major after starting elsewhere. SPMC had the highest single-year rate at 89.5 percent in 2019–2020, but has declined in recent years. BRDC’s rate remains positive across all five years, while JOUR consistently reports negative rates, with more students leaving than entering.
Net Transfer Rate | |||||
| Graduating Major | 2019-2020 | 2020-2021 | 2021-2022 | 2022-2023 | 2023-2024 |
| ADPR | 65.1% | 72.4% | 73.9% | 65.4% | 68.5% |
| BRDC | 11.9% | 33.3% | 50.0% | 41.7% | 28.6% |
| JOUR | -40.6% | -25.6% | -12.1% | -41.7% | -37.5% |
| SPMC | 89.5% | 64.1% | 28.1% | 25.0% | 7.7% |
These patterns show which majors are most attractive to students and which may need closer attention. Positive net rates suggest that a major offers flexibility, relevance, and strong alignment with student goals. Negative rates may indicate the need for clearer pathways, updated curriculum, or stronger advising to retain students who initially choose the program.